1.1The Nature of Econometrics
Is econometrics just statistics applied to economic problems? To say so seems insulting. After all, econometricians have made many fundamental contributions to the theory and practice of quantitative modeling. At the same time, we do ourselves a disservice if we fail to link common principles from different fields.
So is the answer yes or no? And if no, what is econometrics?
We can probably agree that econometrics is concerned with quantitative analysis of economic problems using data. One of the idiosyncrasies of economic data is that most are observational, as opposed to experimental. The prevalence of observational data has been an ongoing challenge for econometricians, especially those concerned with causal inference. This challenge has certainly shaped what we call econometrics.
Another idiosyncrasy of econometrics is that it models the implications of choices made by people, and human beings have stubbornly refused to adopt the kinds of behavioral patterns that would make their choices easy to replicate consistently in quantitative models. Even the best economic models are only right along one or two dimensions. This fact has led to a relative emphasis on estimation methods that use partially specified models, such as the generalized method of moments.
A third notable feature of econometrics is that it tends to focus more on models that explain than models that predict. This is particularly so if you compare econometrics to fields like data science or machine learning. For example, consider the following quote from Vapnik (2006):
I believe that something drastic has happened in computer science and machine learning. Until recently, philosophy was based on the idea that the world is simple. In machine learning, for the first time, we have examples where the world is not simple. For example, when we solve the "forest" problem [and] use data of size 15,000 we get 85%–87% accuracy. However, when we use 500,000 training examples we achieve 98% correct answers. This means that a good decision rule is not a simple one, it cannot be described by a very few parameters....
So the question is, what is the real world? Is it simple or complex? Machine learning shows that there are examples of complex worlds. We should approach complex worlds from a completely different position than simple worlds. For example, in a complex world one should give up explain-ability (the main goal in classical science) to gain better predictability.
Putting aside the issue of whether economics should be modeled as a "complex world," the quote above nicely illustrates the trade-off between optimizing out-of-sample prediction versus fitting simple models where parameters have straightforward interpretations. Economists have traditionally focused on the latter, which is why topics such as identification are central to econometrics while at the same time largely ignored in fields like data science.
So far the discussion points to econometrics being relatively unique, and distinct from statistics. Let’s look at the reverse claim. There’s really only one argument running in this direction, but it’s a good one. The fundamental problem of econometrics is exactly the same as the fundamental problem of statistics: a finite set of data is observed, and on the basis of these data, we seek to make general statements.
For example, suppose that a group of 100 pilot schools receive a treatment, such as a new reading program. The treatment is found to produce desired outcomes vis-à-vis some classification scheme in 95% of cases. On the basis of this test, it is claimed that the treatment is highly effective. The implication of this claim is that we can generalize to the wider population. The interest is not so much in what happened to the pilot schools but rather on what the outcome for the pilot schools implies for other schools. What we as econometricians/statisticians want to know is: to what extent is generalization valid in this and other instances?
Another word for generalization is induction. Inductive learning is where reasoning proceeds from the specific to the general—as opposed to deductive learning, which proceeds from general to specific. As researchers and scientists we often celebrate deductive reasoning, but the more you think about the human ability to generalize, the more striking and remarkable it seems. How is it that a 3 year old can determine that a dog it has never seen before is in fact a dog—rather than a cat, say, or a donkey? Surely most of this ability comes from induction rather than from following deductive rules. The child’s brain has learned to generalize from examples.
At the same time, some problems are harder for our brains to generalize over. While our ancestors best able to distinguish among types of wild creatures were certainly more successful in passing on their genes, little in the natural or social world of the past thousand or so millennia has prepared Homo sapiens for trying to back out the probabilistic structure behind firm size distributions, or to distinguish among diffusion processes most appropriate for tracking asset prices. Statistics and econometrics are ways for us to scale and codify our inductive learning abilities in order to confront these new problems.
This, then, is the fundamental problem of both econometrics and statistics: in the modern world we have lots of data, but still lack deep knowledge on how many systems work, or how different economic variables are related to one another. What is the process of extracting general knowledge from data—that is, from specific observations? What are the best techniques to use? Under what conditions will this process be successful?
1.2Data versus Theory
One of the recurring issues in any form of statistical learning is the need to blend theory with data. To illustrate the idea, suppose that we observe inputs to some system, as well as corresponding outputs . For example, the inputs might be a "treatment," such as the school reading program mentioned above. Outputs could be a measure of the effect of this treatment. Or inputs could be a mix of policy instruments such as spending and interest rates, with outputs being the response of quantities like inflation or unemployment. Given the observed input–output pairs, we seek a function such that, given a new pair , the value will accurately predict the corresponding output .
If we knew the joint distribution of pairs, then we could compute or approximate the conditional expectation , which, as we’ll see, has a strong claim to being the best predictor of given . Our problem lies in the fact that we don’t know the distribution. Instead, we have the sample, which contains some but not all information about the joint distribution.
In problems such as this, our ability to generalize requires more than just data. Ideally, data are combined with a theoretical model that encapsulates our knowledge of the system we are studying. Data can be used to pin down parameter values for the model. If our model is good, then combining the model with data allows us to gain an understanding of how the system works.
Even when we have no formal model of how the system works, we cannot avoid assumptions if we want to generalize. Figure 1.1 helps illustrate this idea. Consider the regression setting described above, with scalar input . Imagine that the dots shown in the figure are our data. Now make a guess as to the likely value of the output , given new value 4.
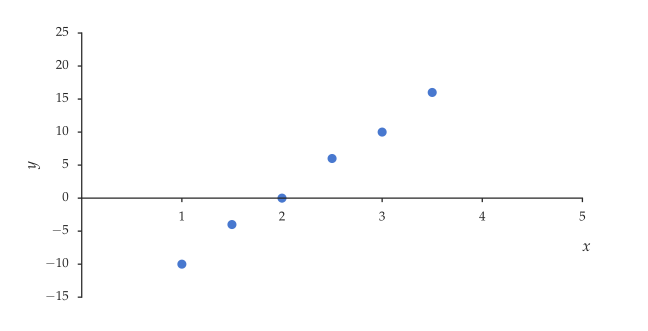
Figure 1.1:Generalization requires knowledge
Did you select a value close to 20? If so, this is because your brain picks up a pattern: the dots lie roughly on a straight line. Our brains have been trained or hardwired to notice these kinds of patterns. And even though this thought process is subconscious, in the end we are bringing our own assumptions into play.
Depending on the problem at hand, our assumption about the linear relationship could, of course, be completely wrong.[1] But the point is that we cannot forecast a new observation from the data alone. There is no free lunch. We have to take a stand and make some assumptions as to the functional relationship in order to guess a likely output given our new input. Those assumptions may come from knowledge of the system, or they might come from the customs of a particular academic community. Either way, we are adding something to the data in order to make inferences about likely outcomes.
We have spent some time on this point because it’s essential that we are aware of what assumptions are being made in any given estimation problem, what justification is used for them, and what impact they might have. This process allows us to be critical. One of the aims of this book is to draw out assumptions behind different econometric procedures and their respective implications. You shouldn’t treat any of these assumptions as sound without forming your own judgment.
1.3Comments on the Literature
Much of the innovation in the field of statistics over the past few decades has been driven by the branch of research referred to above as machine learning, or data science. The term "statistical learning" is also used to describe this approach to inference. The field is distinguished by its use of flexible, high-dimensional models combined with large amounts of data. High-profile successes in applied problems have now been matched with important theoretical progress in the foundations of statistics.
These trends have had less impact on the field of econometrics. One reason is that microeconometrics has a long tradition of causal modeling using relatively simple models and a small number of covariates. Another is that structural modeling holds out the possibility of generating estimated macroeconomic models that are robust to the Lucas critique. It’s not so clear how high-dimensional data-centric methods should be tied to these kinds of models.
Yet, economics does involve the study of highly complex relationships. Think first about the number of forces acting on the sail of a ship or a projectile fired from a gun. We can accurately model outcomes by considering only a few forces. But how many forces determine the price of US treasuries? How many forces determine educational outcomes across the United States for Hispanic males? Perhaps these are examples of Vapnik’s "complex worlds," where relatively large amounts of data and flexible models are required.
While there are no definitive answers to these questions, the theory of statistical learning and the ever-expanding work of the machine learning community certainly offer important insights. Their ideas will shape our treatment of some fundamental econometric problems, including linear regression and model selection.
1.4Further Reading
More extensive discussions of econometrics versus statistics can be found in Heckman (1992) and the early chapters of Hill et al. (2008), Wooldridge (2010), and Kennedy (2008). An overview of modern econometrics can be found in Geweke et al. (2006).
High-quality texts on the theory and applications of machine learning and statistical learning include Friedman et al. (2009), Bishop (2006), Vapnik (2000), and Abu-Mostafa et al. (2012). For some additional discussion of how machine learning techniques might be applied to econometric modeling, see Einav & Levin (2014), Varian (2014), Athey & Wager (2015), and Athey (2015).
For example, in 1929 the economist Irving Fisher famously declared “Stocks have reached what looks like a permanently high plateau.” On that occasion linear extrapolation turned out to be a poor prediction rule.
- Vapnik, V. N. (2006). Estimation of Dependences Based on Empirical Data. New York: Springer.
- Heckman, J. J. (1992). Haavelmo and the birth of modern econometrics: A review of the history of econometric ideas by Mary Morgan. Journal of Economic Literature, 30(2), 876–886.
- Hill, R. C., Griffiths, W. E., & Lim, G. C. (2008). Principles of Econometrics (Vol. 5). Hoboken, NJ: Wiley.
- Wooldridge, J. M. (2010). Econometric Analysis of Cross Section and Panel Data (2nd ed.). Cambridge: MIT Press.
- Kennedy, P. (2008). A Guide to Econometrics (6th ed.). Hoboken, NJ: Wiley Blackwell.
- Geweke, J., Horowitz, J. L., & Pesaran, M. (2006). Econometrics: a bird’s eye view [Techreport]. CESifo Group Munich.
- Friedman, J., Hastie, T., & Tibshirani, R. (2009). The Elements of Statistical Learning (2nd ed.). New York: Springer.
- Bishop, C. M. (2006). Pattern Recognition and Machine Learning. New York: Springer.
- Vapnik, V. N. (2000). The Nature of Statistical Learning Theory (2nd ed.). New York: Springer.
- Abu-Mostafa, Y. S., Magdon-Ismail, M., & Lin, H.-T. (2012). Learning from Data. AMLBook.com.
- Varian, H. R. (2014). Big data: New tricks for econometrics. The Journal of Economic Perspectives, 28, 3–27.
- Athey, S., & Wager, S. (2015). Estimation and Inference of Heterogeneous Treatment Effects using Random Forests [Techreport]. arXiv preprint arXiv:1510.04342.
- Athey, S. (2015). Machine Learning and Causal Inference for Policy Evaluation. Proceedings of the 21th ACM SIGKDD International Conference on Knowledge Discovery and Data Mining, 5–6.