Charts#
Visual summary of the May 2026 audit across 5 lecture series and 7 in-scope rule categories. All figures are generated at build time from the audit data below.
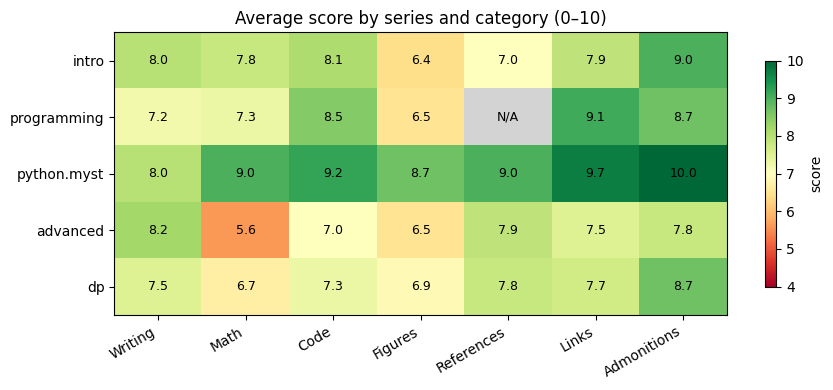
Score heatmap — series × category#
Darker red marks weaker categories. The two clear weak spots are Math in lecture-python-advanced.myst (5.6) and Figures across every series (6.4–6.9 except python.myst).
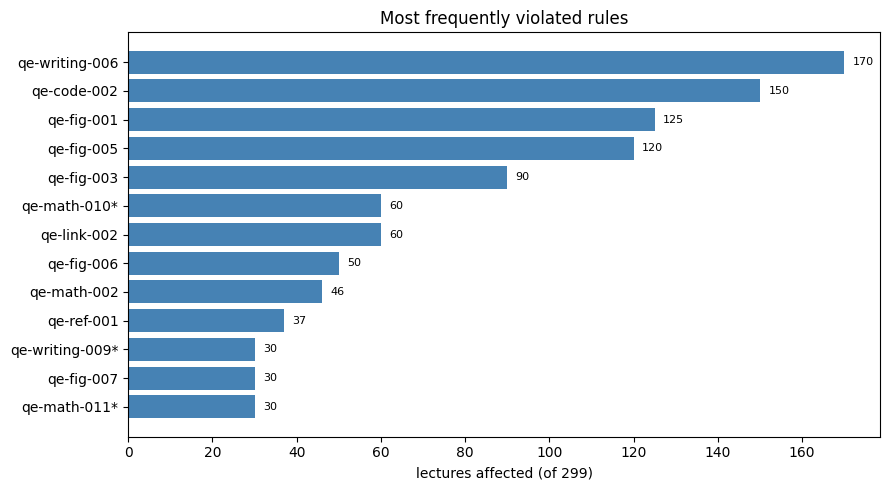
Top systemic issues — lectures affected#
Across all 299 lectures, these rules are violated most often. Figures and Code now sit alongside the long-standing heading-case issue. Rules marked * are proposed additions to the rule registry (not yet coded).
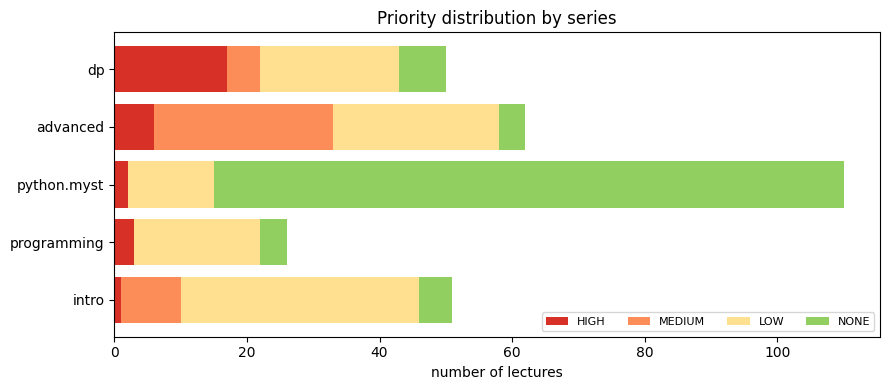
Priority distribution by series#
lecture-python.myst is overwhelmingly NONE/LOW; lecture-dp and lecture-python-advanced.myst carry most of the HIGH-priority work.
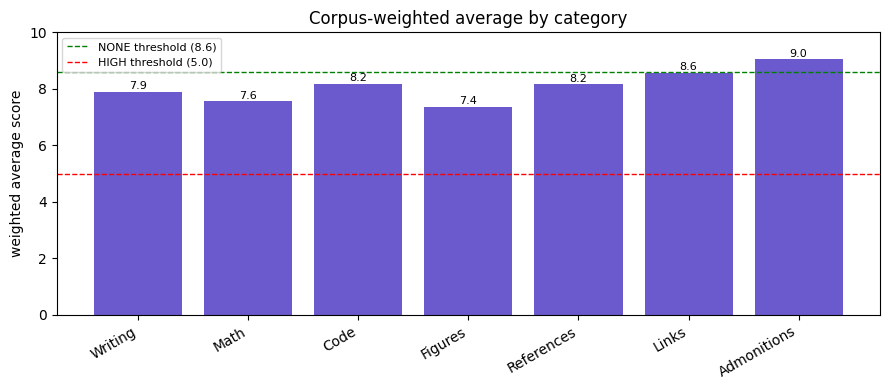
Corpus-weighted category averages#
Where the corpus is strongest (Admonitions, Links) and weakest (Figures, Math).
Note
These figures are generated from inline data for the 2026-05 audit. When this becomes a recurring monthly pass (see the project roadmap), the data should move to a versioned data/scores.csv so trends can be charted across audit dates.