National Graduate Institute for Policy Studies (GRIPS)
To study relationships between random variables we need to add more concepts to our toolkit. In this chapter we review multivariate distributions and give a rigorous construction of conditional expectation.
In Section 4.1.3 we defined a random variable to be a function x:Ω→R with the property that {x∈B} is an event for any Borel set B∈B(R). The definition of a random vector is analogous. A random vectorx in RN is a function from Ω to RN with the property that
This is just (4.9) with B(RN) replacing B(R). In statistical applications we can almost always cook up a sample space Ω and a set of events F on Ω such that all random vectors we care about satisfy (5.1).[1]
It’s also possible to define a random vectorx in RN as a tuple of N random variables (x1,…,xN). The two definitions are equivalent. As with ordinary vectors, random vectors have no intrinsic shape, and we’ll write them in rows or columns according to convenience. However, in expressions involving matrix multiplication, random vectors will default to column vectors unless otherwise stated.
The definition of a random vector ensures that {x∈B} is a well-defined event for every B∈B(RN). If we want to ensure that some transformation y=f(x) is likewise a random vector, we need a restriction on f so that {y∈B} is also a well-defined event. The appropriate restriction is B-measurability, which, analogous to the scalar case , means that f:RN→RM satisfies f−1(B)∈B(RN) for all B∈B(RM). As in the scalar case, every kind of transformation we use in this text is B-measurable, so the restriction is never binding.
Expectations of random vectors are defined element-by-element. In particular, if x=(x1,…,xN) is a random vector in RN, then its expectationEx is defined as the vector of expectations
Ex=Ex1x2⋮xN:=Ex1Ex2⋮ExN
An M×Nrandom matrixX is an M×N array of random variables. Its expectation is defined as
EX:=Ex11⋮ExM1⋯⋯Ex1N⋮ExMN
Fact 5.1.1 is obtained by repeated application of the linearity of scalar expectations stated in fact 4.1.5.
The variance–covariance matrix of a random vector x in RN with μ:=Ex is the N×N matrix
The definition of a distribution over RN generalizes that of a distribution over R given in Section 4.2.1. In particular, a distribution or lawP on RN is a probability measure over the Borel sets B(RN). By definition, it satisfies P(RN)=1 and P(∪n=1∞Bn)=∑n=1∞P(Bn) for any disjoint sequence {Bn} in B(RN). See also the properties of probability measures listed in fact 4.1.1.
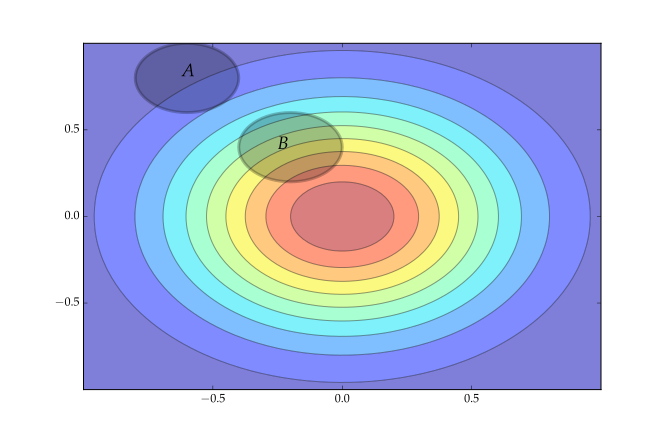
Figure 5.1 shows a visualization of a distribution P on R2, with hot colors indicating regions of high probability. (The distribution is multivariate Gaussian, to be defined below.) The sets A and B are typical Borel sets. In the figure, B has the same area as A but is assigned greater probability by P. By additivity, we know that P(A∪B)=P(A)+P(B) must hold.
Figure 5.1:Example distribution and events A and B
As was the case for R, distributions on RN are fully characterized by their values on certain more elementary families of subsets of RN. For example, for any two distributions Q,P on RN,
P(I)=Q(I) for all I∈R⟹P(B)=Q(B) for all B∈B(RN)
where R denotes the family of all cylinder sets
C=B1×⋯×BN,Bn∈B(R),n=1,…,N
or, specializing further, the family of all rectangles[2]
I=(−∞,s1]×⋯×(−∞,sN],sn∈R,n=1,…,N
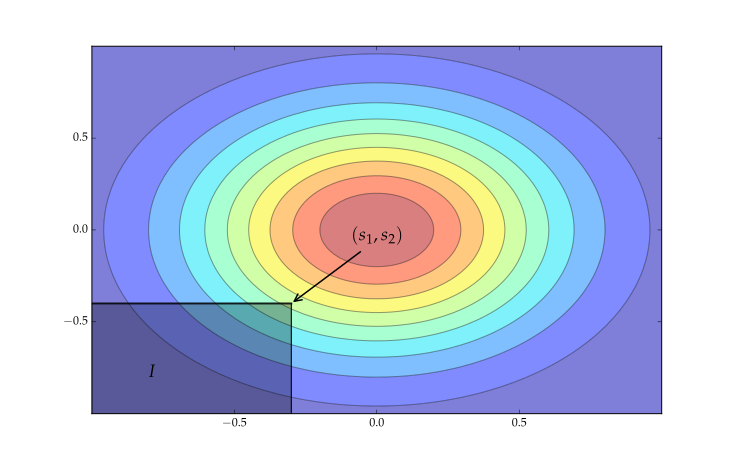
(See prop 3.7 of Çinlar(2011).) Figure 5.2 shows an example set I=(−∞,s1]×(−∞,s2] in the case of R2.
Figure 5.2:Distributions are characterized by their values on elements of R
Thus, analogous to (4.24), any distribution P on RN is characterized by the function
This is an example of a multivariate cumulative distribution function, which is a function F:RN→[0,1] that is
right-continuous in each of its arguments,
increasing in each of its arguments, and
satisfies
F(sj)→1 as sj→∞andF(s1,…,snj,…,sN)→0 as snj→−∞
As in the one-dimensional case, we will call a distribution P on RNdiscrete if P is supported on a countable subset of RN, and absolutely continuous if P(B)=0 whenever B has zero Lebesgue measure. The latter condition is again necessary and sufficient for existence of a density representation, by which we mean existence of a density p on RN such that
Let’s describe one important way to construct multivariate distributions.
This distribution is called the product distribution of P1,…,PN. If Pn=P for all n, then we’ll call P˚ the Nth product of P. The uniqueness part of fact 5.1.4 follows from the claim above that distributions on RN are uniquely pinned down by their values on cylinder subsets of RN. As we’ll see, product distributions correspond to joint distributions of independent random variables.
Given any distribution P on RN, the nth marginal distribution of P is the distribution on R defined by
Pn(B)=P(R×⋯×R×B×R×⋯×R)
Here B is the nth element of the Cartesian product. We can also write this as
Pn(B)=P{s∈RN:s⊺en∈B}
The nth marginal tells us the probabilistic implications of P when we only concern ourselves with the outcomes for the nth coordinate. From Pn we can also extract the marginal CDF Fn via (4.24).
If Pn is absolutely continuous, it has density pn. When the joint distribution P has a density p, the marginal distribution Pn has a density, and pn can be obtained directly from p by integrating out the other variables. For example, in the bivariate case,
p1(s1)=∫−∞∞p(s1,s2)ds2
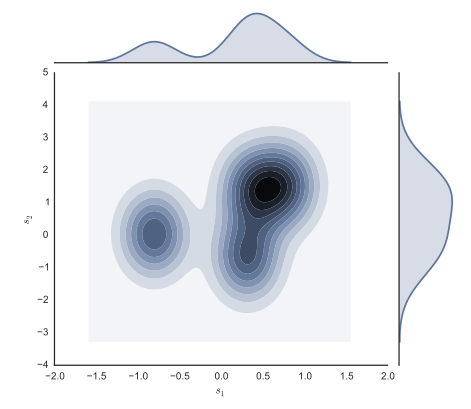
Figure 5.4 shows a bivariate density represented by contours and the two marginals obtained from projecting onto each axis.
Figure 5.4:Bivariate joint density and its two marginals
In general, the joint distribution cannot be determined from the marginals alone, since the marginals do not tell us about the interactions across coordinates. The exception is when there is no interaction. This is the case for product distributions, as described in fact 5.1.4 and further discussed in Section 5.1.4.
In this context, P is also called the joint distribution of x1,…,xN, and we write L(x)=P. The joint distribution can also be represented by the multivariate CDF F:RN→[0,1] defined by (5.3), which in this case can be written as F(s1,…,sN)=P{x1⩽s1,…,xN⩽sN}, or, in vector notation,
F(s)=P{x⩽s}(s∈RN)
It follows from (5.4) that when the distribution P of x is absolutely continuous, there exists a nonnegative function p on RN satisfying
Here ∫B is a multivariate integral over the region B. The function p is called either the density or joint density of x. For (5.8) to hold, it suffices that
This is of course the marginal distribution relative to the joint distribution of x, as introduced in Section 5.1.2.1. In this context it is called the marginal distribution of xn in order to distinguish it from the (joint) distribution of x. From a mathematical perspective, the marginal distribution of xn and the distribution of xn are identical.
If P1=P2=⋯=PN, then we say that x1,…,xN are identically distributed.
Let z be standard normal on R. A random variable x is said to be normally distributed if x=μ+σz for some σ⩾0, and we write L(x)=N(μ,σ). Here we explicitly allow the possibility that σ=0, in which case var[x]=0 and P{x=μ}=1.
A random vector x in RN is called multivariate normal or multivariate Gaussian if there exists a K×1 standard normal random vector z, an N×K matrix C and an N×1 vector μ such that
Once again we explicitly allow degenerate cases, since they occur frequently in statistics. If x is multivariate normal, then we write L(x)=N(μ,Σ), where
Be aware that L(x)=N(μ,Σ) does not imply that x has the multivariate normal density in (5.6). The reason is that the distribution of x can fail to be absolutely continuous. For example, if C=0 in (5.11), then x puts all mass on a single point in RN. Without absolute continuity, no density representation can exist.
Absolute continuity of the distribution of x coincides with the setting where Σ:=varx is nonsingular. (Perhaps because of this, the scenario where a random vector has a density is sometimes called the "nonsingular case" by econometricians.) For x defined in (5.11), nonsingularity of Σ will be true if and only if C⊺ has full column rank (see ex. 3.5.28).
One corollary of fact 5.1.5 is that if x=(x1,…,xN) is multivariate normal, then the marginal distribution of xn is univariate normal. This can be seen by taking a=en in part (i). In fact the rule in part (ii) implies that
Here’s a common exam question: Is it true that the joint distribution of N univariate normal random variables is always multivariate normal? The answer is no. A counterexample is given in Section 5.1.5. See also fact 5.1.14 below.
Let h:RN→R be any B-measurable function and let P be a distribution on RN. In Section 4.2.3 we saw that one can assign meaning to the expression ∫h(s)P(ds) by treating h as a random variable on (R,B(R),P) and taking its expectation. We can do exactly the same thing in RN, with h now regarded as a random variable on (RN,B(RN),P). Its expectation will be written as
The right-hand side of (5.15) should be understood as
∫−∞∞⋯∫−∞∞h(s1,…,sN)p(s1,…,sN)ds1⋯dsN
In Section 4.2.5 we saw that expectations of functions of random variables can be computed from their distributions. The same is true for functions of random vectors. In particular, suppose that we want to compute Eh(x), where h:RN→R is B-measurable. We can do this either by evaluating the expectation of h(x) on the original probability space (Ω,F,P), or we can take the distribution P of x and compute the expectation of h on (RN,B(RN),P). This is formalized in the following extension to fact 4.2.8.
As in the univariate case, this means that objects like moments are properties of the distribution. For example, let x be a random vector in RK with L(x)=P. The variance–covariance matrix var[x] of x has i,jth element E[xixj]−E[xi]E[xj]. We can write this in terms of P. In particular, if
for any B1,…,BN, where each Bn is a Borel subset of R. In view of the definition of independence of events, the random variables x1,…,xN are independent precisely when sets of the form {x1∈B1},…,{xN∈BN} are independent events.
An infinite set of random variables {xn}n=1∞ is called independent if any finite subset of {xn}n=1∞ is independent in the sense of the preceding definition. We use the abbreviation IID for collections of random variables that are both independent and identically distributed. If we state that {xn}n=1∞ are IID copies of x, we mean that the random variables {xn}n=1∞ are IID with the same distribution as x.
There are a number of equivalent ways that we can rephrase the definition of independence. Since ∩n=1N{xn∈Bn}={(x1,…,xN)∈B1×⋯×BN}, a direct translation of (5.17) using (5.7) and (5.10) gives
Here P is the joint distribution of x=(x1,…,xN) and Pn is its nth marginal. Thus, the elements of a random vector are independent if and only if their joint distribution equals the product distribution formed from their marginals (see fact 5.1.4).
The left- and right-hand sides of (5.18) agree for all B1,…,BN if they agree on certain families of sets, like the rectangles discussed in Section 5.1.2. For this reason a necessary and sufficient condition for independence of x1,…,xN is
for all (s1,…,sN)∈RN, where F is the CDF of x and F1,…,FN are the marginal CDFs. If the distribution of x is absolutely continuous we can also test independence via its density:
The next fact is true in general but most easily verified in the density case, where you can apply (5.15) and fact 5.1.8.
The definition of independence of random vectors is almost identical to the scalar case. Random vectors x1,…,xN in RK are called independent if
for any B1,…,BN, where each Bn is a Borel subset of RK.
To see why, observe that fn(xn)∈Bn if and only if xn∈f−1(Bn), as follows from the definition of preimage of a set (see Section 15.2). This leads to
Note that the converse is not true: one can construct examples of dependent random variables with zero covariance. However,
We already proved a simple version of this in example 5.1.4. A full proof can be put together using the theory of characteristic functions (see, e.g., ch. 5 of Gut(2009)). Below are two useful related results. The first one links orthogonal projection and multivariate Gaussians (ex. 5.4.11 requests a proof).
This last fact is important because sums of arbitrary normals are not always normal. What is required is a multivariate normal distribution. Fact 5.1.14 works because independence pins down the joint distribution as multivariate normal. In particular, L(w1,…,wN)=N(μ,Σ) where en⊺μ=μn and Σ=diag(σ12,…,σN2). The expression for the variance in fact 5.1.14 follows from fact 4.1.10.
A copulaC on RN is a multivariate CDF supported on the unit hypercube [0,1]N with the property that all its marginals are uniform on [0,1]. In other words, C is a function of the form
where 0⩽sn⩽1 and L(un)=U[0,1] for all n. There are many possible copulas because, while each un has its marginal distribution pinned down, there are infinitely many ways to specify the joint distribution.
One reason that copulas are useful is that we can take univariate CDFs F1,…,FN and a copula C and create a multivariate CDF on RN via
The benefit of creating a multivariate CDF using this two step procedure is that in specifying a multivariate distribution we can separate out specification of the marginals, which give probabilities for isolated coordinates, and specification of the joint distribution, which defines the interactions.
How rich is the set of multivariate CDFs we can create via (5.22)? It is universal. This is one part of a well-known theorem due to Sklar (1959):
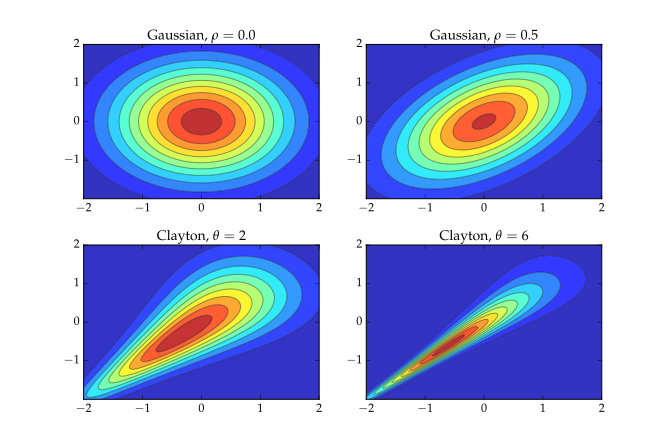
Copulas can be used to clarify a point raised in Section 5.1.3.2: normal marginals are not sufficient for the multivariate normal property. If F1,…,FN are univariate normal, then C(F1(s1),…,FN(sN)) will equal the multivariate normal CDF for one choice of copula, called the Gaussian copula. Other choices lead to different distributions. Figure 5.5 gives an illustration where the top two distributions are multivariate normal and the bottom two are created by pairing the Clayton copula with univariate normal marginals. The distributions are represented as densities.
Figure 5.5:Bivariate Gaussian (top) and non-Gaussian (bottom)
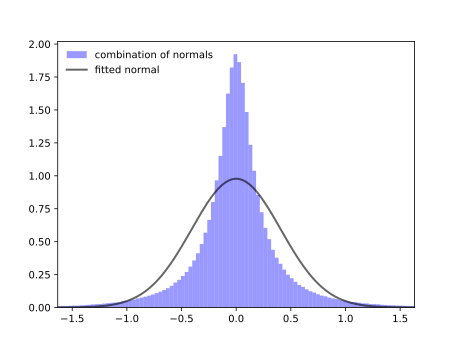
A related point is that while linear combinations of normal random variables are often thought to be normal, this isn’t true unless the original random variables are multivariate normal (cf., fact 5.1.5) or independent (which is a special case of multivariate normal). As an example, figure 5.6 shows a histogram of draws from w=x−y when (x,y) is distributed according to the density in the lower right panel of figure 5.5. For comparison, a normal density with the same mean and standard deviation is plotted.
Here are some useful facts relating independence and certain common distributions.
Figure 5.6:Normality is not necessarily preserved under linear transformations
Let’s note some facts connecting chi-squared and normal random variables. First, if L(x)=N(0,1), then L(x2)=χ2(1). Exercise 5.4.4 asks you to prove this. Second, if a collection of standard normals are independent, then so are their squares (fact 5.1.10). Combining this result with fact 5.1.15 gives
The next result generalizes fact 5.1.18 and crops up frequently in statistics.
We can obtain fact 5.1.19 from fact 5.1.18 as follows. Since A is symmetric, we use the spectral decomposition theorem to write it as A=QΛQ⊺, where Q is an orthogonal matrix and Λ=diag(λ1,…,λN) with λn:= the nth eigenvalue of A. Setting y:=Q⊺z, we have
z⊺Az=z⊺QΛQ⊺z=y⊺Λy=n=1∑Nλnyn2
By exercise 3.5.35, idempotence of A implies all eigenvalues lie in {0,1}. By fact 3.2.7, the number of nonzero eigenvalues is equal to traceA. It follows that z⊺Az is the sum of yn2 over K:=traceA nonzero terms. By fact 5.1.18, a random variable with this property is χ2(K) whenever y is standard normal. Combining L(z)=N(0,I) and fact 5.1.5, we have L(y)=N(0,Q⊺Q). But Q is an orthogonal matrix, so Q⊺Q=I.
Conditional expectation is one of the most important concepts in both economic theory and econometrics. This section gives a construction of expectation based around projection, which, in my view, is more intuitive and rewarding than both the elementary treatments using conditional distributions and the advanced treatments using Radon–Nykodym derivatives. The construction begins by formalizing the concepts of information and conditioning. We then build on our knowledge of orthogonal projection from Section 3.3 to frame conditional expectation as optimal prediction given limited information.
Let’s briefly discuss conditional distributions, focusing on the density case. Let x1 and x2 be random variables. The conditional density of x2 given x1=s1 is defined as
whenever the denominator is nonzero. Here p stands in for either joint, marginal, or conditional density, with the type determined by the argument. (For example, p(si) is the marginal density of xi evaluated at si.)
The law of total probability extends to the density case as follows: If (x1,x2) is a random vector on R2, then
The same ideas extend to additional arguments in a natural way. For example, the conditional density of xk+1,…,xN given x1=s1,…,xk=sk is defined by
Suppose we want to predict random variable y using another variable x. In this case we should choose x such that x and y are expected to be close under most realizations of uncertainty. But what does "expected to be close" mean?
Perhaps the most common measure of distance between random variables is mean squared error (MSE), which is defined in this case as E[(x−y)2]. We met this concept previously in the linear prediction problem of Section 4.1.5. A common variation on MSE is root mean squared error, which, as the name suggests, is defined as
On the right-hand side of (5.28) we have a measure of distance between random variables. On the left-hand side we have used the same symbol as we used for Euclidean norm distance between two vectors. This is both deliberate and conventional, as there are many parallels between ordinary vector space with the Euclidean norm and the set of random variables combined with the "norm" defined in (5.28). Let’s now clarify and formalize these ideas.
The first geometric concept we defined for vectors was inner product. Analogously, we define here the inner product between two random variablesx and y as
Of course we want this definition to make sense, and the Cauchy–Schwarz inequality for random variables tells us that E[xy] will be finite and well-defined whenever x and y both have finite second moments. Hence we restrict attention to this set, which is commonly denoted L2. That is,
L2:={ all random variables x on (Ω,F,P) with E[x2]<∞}
Here’s a list of some of the ways that L2 inner product is similar to the Euclidean inner product on RN.
If you compare fact 5.2.1 with fact 2.1.1 you’ll see that the correspondence is essentially one-to-one. The properties in fact 5.2.1 follow from the definition of the inner product and linearity of E (see fact 4.1.5).
Analogous to the Euclidean vector norm, we define the L2 norm by
From this norm we get a notion of distance ∥x−y∥ between random variables that agrees with the notion of root MSE in (5.28). As with inner product, the properties of the L2 norm and vector norm are largely identical. (Compare the following with fact 2.1.2.)
Point (i) requires a clarification, which is given below. Property (ii) is immediate from (5.30) and the linearity of E. Property (iii) is called the triangle inequality, as in the vector case. Property (iv) is just the Cauchy–Schwarz inequality, restated in new notation. As in the vector case, the triangle inequality can be proved from the Cauchy–Schwarz inequality. For a proof, see exercise 5.4.15.
Returning to (i), it isn’t true that ∥x∥=0 implies x(ω)=0 for all ω∈Ω. What we can say is that if ∥x∥=0 then P{x=0}=1 (see, e.g., Williams(1991), §5.2). If we agree not to distinguish between random variables that only differ with zero probability, then (i) is valid. This is the standard convention when dealing with L2.
From (ii) and (iii) of fact 5.2.2, we see that if α,β∈R and x,y∈L2, then αx+βy also has finite norm, and is therefore in L2. More generally, any linear combination
α1x1+⋯αKxK,αk∈R,xk∈L2
is again in L2. As in the vector case (see Section 2.1.2), when X is a subset of L2, the set of finite linear combinations that can be formed from elements of X is called the span of X, and denoted by spanX.
A subset S of L2 is called a linear subspace of L2 if it is closed under addition and scalar multiplication. That is, for each x,y∈S and α,β∈R, we have αx+βy∈S.
As in RN, an orthonormal basis of a linear subspace S of L2 is a set {u1,…,uK}⊂S with the property that
Given that inner products and norms in L2 share so many properties with their Euclidean cousins, it’s not surprising that many results about RN carry over to L2. Often we can just lift the proofs across with barely a change to notation. We know a great deal about vectors and Euclidean space, so this process yields many insights about random variables. Let’s illustrate this in the context of orthogonal projection.
As in the Euclidean case, if ⟨x,y⟩=0, then we say that x and y are orthogonal, and write x⊥y. This terminology is used frequently in econometrics. Its importance stems partly from the next fact, the proof of which is a short exercise.
Now consider the following problem. Given y∈L2 and linear subspace S⊂L2, we seek the closest element y^ of S to y. Closeness is in terms of L2 norm, so y^ is the minimizer of ∥y−z∥ over all z∈S. That is, we seek
The next theorem mimics theorem 2.2.1. A nice treatment that covers the current setting can be found in chapter 2 of Cheney (2001).
The statement that S is closed means that {xn}⊂S and x∈L2 with ∥xn−x∥→0 implies x∈S. This condition is true for all the linear subspaces we want to work with.
Analogous with the case of RN, the random variable y^ in theorem 5.2.1 is called the orthogonal projection of y onto S. Holding S fixed, we can think of the operation
y↦ the orthogonal projection of y onto S
as a function from L2 to L2. The function will be denoted by P, so that, for each y∈L2, the symbol Py represents the image of y under P, which is the orthogonal projection y^. As before, P is called the orthogonal projection onto S, and we write P=projS. Since Py solves (5.32), we can and do interpret Py as the best predictor of y from within the collection of random variables contained in S.
Compare with theorem 2.2.2. In (i), the statement that P is linear means that P(αx+βy)=αPx+βPy for all x,y∈L2 and α,β∈R.
The next two results are L2 versions of fact 2.2.7 and fact 2.2.6 respectively. The proofs are essentially the same.
Let’s consider an extension of the best linear prediction problem of example 5.2.6 to a more general setting, where the information for predicting y is a random vector x in RK. As before, prediction will be linear, with the aim of minimizing squared error. Hence the object we seek is the L2 orthogonal projection of y onto the linear subspace
span{x}:= all random variables of the form x⊺b for some b∈RK
To make sure that span{x}⊂L2, we will assume that E[x⊺x]<∞.
Exercise 5.4.16 asks you to prove this. Positive definiteness of E[xx⊺] ensures invertibility, without which the vector b∗ is not uniquely defined (see ex. 3.5.34). Note that, by the definition of orthogonal projections, b∗ necessarily satisfies
b∗=a∈RKargminE[(y−x⊺a)2]
The linear prediction problem considered here is also called population linear regression. The "population" qualifier is because we are using the true joint distribution of (x,y) when we compute expectations. Population regression has a sample counterpart called multivariate linear regression, based on observations of (x,y). We will discuss it at length in chapter 11.
While the use of projections to obtain best linear predictors in example 5.2.6 and fact 5.2.7 is elegant and useful, we don’t always want to constrain ourselves to linear predictions. To drop the linearity requirement, we change the linear subspaces used for projection from the set of linear functions of x to the set of arbitrary functions of x. As we now show, the best predictor that results is exactly the conditional expectation with respect to x.
The key to this process is defining the subspace to project onto. In the language of probability, the subspace of arbitrary real-valued functions of x is called the x-measurable functions. Let’s take these ideas one step at a time, starting with the notion of measurability with respect to information sets.
Let G:={x1,…,xD} be any set of random variables and let z be any other random variable. The variable z is said to be G-measurable if there exists a B-measurable function g:RD→R such that
In this context, G is sometimes referred to as the information set. When convenient we’ll also write x=(x1,…,xD) and say that z is x-measurable. Similar terminology will be used for scalars and matrices. For example, if X is a random matrix, then X-measurability means G-measurability when G lists all elements of X.
The intuitive meaning of G-measurability of z is that z is completely determined by the elements in G. Imagine it like this: When uncertainty is realized, some ω is selected from Ω. We don’t get to view ω itself, but we do get to observe the realized values x1(ω),…,xD(ω) on the right-hand side of (5.36). If z is G-measurable, we can now calculate the realized value z(ω) of z, even without knowing ω.
If x and y are known given the information in G, then a third random variable that depends only on x and y is likewise known given G. Hence G-measurability is preserved under the taking of sums, products, and so on. In particular,
Suppose now that G⊂L2, which just means that all the random variables in G have finite second moment. Consider the set
L2(G):={all G-measurable random variables in L2}
In view of fact 5.2.8, we have the following result:
This furnishes us with a subspace to project onto, allowing us to define conditional expectations. But before we do so let’s cover ordering of information sets by set inclusion.
This is intuitive: If z is known once the variables in G are known, then it is certainly known when the extra information provided by H is available.
Incidentally, most advanced probability texts give a definition of G-measurability framed in terms of σ-algebras. This is necessary if you wish to work through all related proofs. But the definition given here is equivalent and intuitive. See theorem 4.4 of Çinlar (2011) if you wish to learn more.
Now it’s time to define conditional expectations. Let G⊂L2 and y be some random variable in L2. The conditional expectation of y given G is written as E[y∣G] or EG[y], and defined as the closest G-measurable random variable to y. More formally,
This definition makes sense. Our understanding of the conditional expectation E[y∣G] is that it is the best predictor of y given the information contained in G. The definition in (5.37) says the same thing. It simultaneously restricts E[y∣G] to be G-measurable, so we can actually compute it once the variables in G are realized, and selects E[y∣G] as the closest such variable to y in terms of RMSE.
But does the minimizer generally exist? And is it unique? The answer to both questions is yes. Comparing (5.37) and (5.32), we see that
E[y∣G]=Pywhen P:=projL2(G)
By theorem 5.2.1, the projection exists and is unique. Theorem 5.2.1 also characterizes E[y∣G] as the unique point y^ in L2 such that
y^∈L2(G)andy−y^⊥z for all z∈L2(G)
Rewriting these conditions in a slightly different way, we can give an alternative (and equivalent) definition of conditional expectation: y^∈L2 is the conditional expectation of y given G if
y^ is G-measurable and
E[y^z]=E[yz] for all G-measurable z∈L2.
When convenient we’ll also use symbols like E[y∣x1,…,xD] or E[y∣x]. These are the same as E[y∣G] when G is defined as the information set containing the variables we condition on.
This is obvious because E[y∣x] is by definition x-measurable. A prediction of y given x has to be a deterministic function of x. The particular function f∗ satisfying f∗(x)=E[y∣x] is called the regression function of y given x. It is, by construction, the best predictor of y given x in terms of mean squared error.
The next example shows that when x and y are linked by a conditional density, then our definition of conditional expectation reduces to the one seen in elementary probability texts. The proof of the claim in the example is the topic of exercise 5.4.23.
Here are some goodies we can harvest using the fact that E[⋅∣G]=projL2(G).
Some of these claims are given as solved exercises. Others follow directly from the definition and from the properties of projections. For example, in (iv) we are saying that if y∈L2(G), then y is projected into itself. This is immediate from (vi) in fact 5.2.4.
Part (ii) is called the the law of iterated expectations. The law follows from the property of orthogonal projections given in fact 2.2.7: Projecting onto the bigger subspace L2(H) and from there onto L2(G) is the same as projecting directly onto the smaller subspace L2(G).
Part (v) is called conditional determinism. It says that if x is known given G then we can treat it as a constant in the conditional expectation.
To recap, given y∈L2 and random vector x in RD, the conditional expectation E[y∣x] is a function f∗ of x, called the regression function of y given x, such that f∗(x) is the best predictor of y in terms of MSE. In other words,
Using conditional determinism we can rewrite the term inside the curly brackets on the right-hand side of (5.40) as (f∗(x)−g(x))E[(y−f∗(x))∣x]. For the second term in this product we have
E[y−f∗(x)∣x]=E[y∣x]−E[f∗(x)∣x]=E[y∣x]−f∗(x)=0
Hence the expectation in (5.40) is zero. Equation (5.39) now follows.
Conditional expectations of random matrices are defined using the notion of conditional expectations for scalar random variables. For example, given random matrices X and Y, we set
Using the definitions, one can show that the properties of scalar conditional expectations in fact 5.2.13 carry over to the matrix setting. Here’s a partial list:
Part (v) shows examples of conditional determinism in the matrix case.
Comprehensive treatments of multivariate distributions can be found in monographs such as Izenman (2008) and Joe (1997). Beautiful treatments of conditional expectation via orthogonal projection in L2 can be found in Williams (1991), Taylor (1997), Schilling (2005), and Çinlar (2011).
Uniqueness is a probability one statement: Any two solutions y^1 and y^2 satisfy P{y^1=y^2}=1. We’ve already agreed not to distinguish between such elements. See the discussion after fact 5.2.2.
Hints: You need to match the density in example 4.2.12 when k=1. Use the fact that Γ(1/2)=π. Try to find the CDF of z2 and differentiate it. In finding the CDF, the solution to exercise 4.4.18 might be helpful.
Çinlar, E. (2011). Probability and Stochastics. New York: Springer.
Gut, A. (2009). An Intermediate Course in Probability (2nd ed.). New York: Springer.
Bonhomme, S., & Robin, J.-M. (2009). Assessing the equalizing force of mobility using short panels: France, 1990–2000. The Review of Economic Studies, 76(1), 63–92.
Sklar, M. (1959). Fonctions de répartition à n dimensions et leurs marges. Publications of the Institute of Statistics, 229–231.
Williams, D. (1991). Probability with Martingales. Cambridge, UK: Cambridge University Press.
Cheney, W. (2001). Analysis for Applied Mathematics. New York: Springer.
Izenman, A. J. (2008). Modern Multivariate Statistical Techniques: Regression, Classification, and Manifold Learning (Vol. 1). New York: Springer.
Joe, H. (1997). Multivariate Models and Multivariate Dependence Concepts (Vol. 73). Boca Raton: CRC Press.
Taylor, J. C. (1997). An Introduction to Measure and Probability. New York: Springer.
Schilling, R. L. (2005). Measures, Integrals and Martingales. Cambridge, UK: Cambridge University Press.