Linear regression is one of the core topics of statistics. It is even more central to econometrics, where a shortage of controlled experiments often leaves econometricians trying to factor heterogeneity out ex post. We begin with a nontraditional view of linear regression based on minimal assumptions.
Let’s start with the kind of prediction problem discussed in Section 8.2.2. We study a system with vector input xn∈RK followed by scalar output yn. For example,
xn is a description of a lottery (probabilities, possible outcomes, etc.) in a controlled experiment and yn is willingness to pay in order to participate (see, e.g., Peysakhovich & Naecker(2015)).
xn is a set of household characteristics (ethnicity, age, location, etc.) and yn is household wealth at some later date (see, e.g., McKernan et al.(2014)).
xn is price of electricity, prices of alternatives, temperature, household income, and measurements of the regional income distribution, while yn is regional electricity consumption (see, e.g., Auffhammer & Wolfram(2014)).
Although we don’t exclude the possibility that y is categorical (i.e., discrete), our loss function will be oriented toward regression (where y takes values in R).
Suppose that we have N observations zn:=(xn,yn), all of which are draws from some fixed joint distribution P. Since P is fixed, we are assuming that the system is stationary across the set of draws. Our aim is to predict new output values from input values on the basis of this data. In particular, our problem is to
choose a function f:RK→R such that f(x) is a good predictor of y
To define "good predictor" mathematically, we need a loss function. Throughout this chapter we will be using quadratic loss. Thus, in the language of Section 8.2.2, our aim is to minimize the prediction risk
As we saw in Section 5.2.5, the minimizer of (11.2) over the set of all B-measurable functions is the regression function f∗(x):=EP[y∣x]. If we could compute this, then all our problems would be solved. But we cannot compute it because P is not known. Instead we apply the principle of empirical risk minimization (see Section 8.2.2), which leads to the problem
Here H is the hypothesis space, a set of candidate functions mapping RK into R. For obvious reasons, the problem (11.3) is called a least squares problem.
If we take H to be the set of all functions from RK to R, then, provided the input vectors are all distinct, we can set the empirical risk Remp(f) to zero by choosing any function f satisfying yn=f(xn) for all n. However, as discussed at length in Section 8.2.3, minimizing empirical risk is different from minimizing the prediction risk R(f). The latter is what we actually want to minimize. Thus H must be restricted.
In this chapter we consider the case H=Hℓ, where Hℓ is all linear functions from RK to R. Recalling theorem 3.1.1, we can write
The term N1 has been dropped because it does not affect the minimizer. This is the multivariate version of (8.22).
The idea of choosing b to minimize (11.5) is intuitive: We are choosing a "line of best fit" to minimize in-sample prediction error. This optimization problem has a long tradition. It dates back at least as far as Carl Gauss’s work on the orbital position of Ceres, published in 1801.
You might be wondering whether the choice H=Hℓ is a suitable one. This is an excellent question. It might not be. However, there are good reasons to start with Hℓ, even in this setting where no linearity assumptions are imposed. First, Hℓ is a natural starting point when seeking a class of simple, well-behaved functions. Second, as we’ll see, setting H=Hℓ allows us to obtain an analytical expression for the minimizer, which simplifies both analysis and computation. Third, the technique has an extension from Hℓ to broader classes of functions, as described in Section 11.2.1.
Now let’s solve (11.5). With our knowledge of overdetermined systems (see Section 3.3.2), we already have all the necessary tools. This will be more obvious after we switch to matrix notation. To do this, let
y:=y1y2⋮yN,xn:=xn1xn2⋮xnK=nth observation of all regressors
Traditionally, this random vector β^ is called the least squares estimator. Once we move to more classical assumptions it will be an estimator of a particular parameter vector. At this stage it just defines our answer to the problem posed in (11.1). That is,
given x∈RK, our prediction of y is f(x)=x⊺β^
In terms of geometric interpretation, since Xβ^ solves (11.8), it is the closest point in colspaceX to y. In particular,
Py=Xβ^whenP:=proj(colspaceX)
(See (3.13).) In what follows, M is the residual projection, as defined in (2.11).
Theorem 3.3.2 and our definition of β^ in (11.9) require that X has full column rank (or, equivalently, that the columns of X are linearly independent—see page ).
By theorem 2.1.3, N⩾K is a necessary condition for assumption 11.1.1 to hold. (If N<K, then RN, which is necessarily spanned by N vectors, cannot contain K linearly independent vectors.)
If assumption 11.1.1 fails, then a minimizer of (11.8) still exists but is no longer unique (see ex. 3.5.34). While we can treat this case, it rarely occurs in well-designed regression problems.
Let’s also put some mild regularity conditions on the common joint distribution P of each data point zn:=(xn,yn).
Finite second moments are imposed because we want to evaluate expected squared errors. This assumption cannot be weakened unless we are willing to work with a different loss function. Positive definiteness of Σx ensures that the asymptotic limit of our estimator is well defined.[1]
There’s a range of standard notation associated with linear least squares estimation. Let’s collect it in one place. First, the projection
y^:=Xβ^=Py
is called the vector of fitted values. The nth fitted value y^n is the prediction xn⊺β^ associated with least squares estimate and the nth observation xn of the input vector. The vector My is often denoted u^, and called the vector of residuals:
u^:=My=y−y^
The vector of residuals corresponds to the error that occurs when y is approximated by Py. From fact 2.2.8 we have
In other words, y can be decomposed into two orthogonal vectors Py and My, where the first represents the best approximation to y in colspaceX, and the second represents the residual.
Related to the fitted values and residuals, we have some standard definitions:
We have stressed a number of times that learning from data (statistics) means generalization from current observations to new ones. As such, the most important measure of success for a statistical procedure is out-of-sample fit. So how does linear least squares perform out-of-sample? We start with a general observation about linear predictors.
Here f∗ is the regression function and b∗=Σx−1E[xy] is the vector of coefficients in the best linear predictor . R(f) is the prediction risk of f and expectations are taken under the unknown joint distribution P of the pairs (x,y).
The proof of theorem 11.1.1 is given in Section 11.1.3.1. For now let’s look at interpretation. The general question is how well we can generalize (i.e., reduce prediction risk) using linear functions. Theorem 11.1.1 decomposes the prediction risk of an arbitrary linear predictor ℓ(x)=x⊺b into three terms:
The intrinsic riskE(y−f∗(x))2.
The approximation errorE(f∗(x)−x⊺b∗)2.
The estimation error(b∗−b)⊺Σx(b∗−b).
The intrinsic risk is also called Bayes risk (see example 8.2.3). It is the residual error after y is approximated with the best possible predictor (i.e., the regression function). It is large to the extent that y is hard to predict using x.
The approximation error or bias is the deviation between the best predictor and the best linear predictor. It reflects the cost of our decision to approximate the regression function using a linear architecture. If this architecture is held fixed, the approximation error is also fixed and cannot be reduced in the estimation process.
The estimation error is caused by the deviation of our estimator from the best linear predictor b∗. This deviation occurs because we are predicting using finite sample information on the joint distribution of (x,y).
Theorem 11.1.1 tells us that once H is set to the class of linear functions, the best we can do is find an estimation method (a learning algorithm) that produces an estimate that is close to b∗ on average when the sample size is sufficiently large. The next result states that the least squares estimator β^ has this property.
The proof is below. Independence is required only for the LLN to function. We could weaken this to ergodicity (see Section 7.1.1) and obtain the same conclusion.[2]
On one level, theorems 11.1.1 and 11.1.2 are reassuring. They tell us that if the underlying process is relatively linear, then we will attain small risk asymptotically. On the other hand, the Glivenko–Cantelli theorem tells us that we can learn everything about the underlying distribution in the limit. Here we are bounded away from this kind of consistency whenever the approximation error is positive.
As will be discussed in chapter 14, a general principle of induction is that we should introduce bias in finite samples to avoid overfitting, while at the same time reducing bias asymptotically, as the empirical distribution converges to the true distribution. By comparison, in standard linear regression the bias is held fixed by the linearity assumption.
In-sample fit measures how well a given model fits the same data set that it was estimated on. The difference between in-sample fit (empirical risk) and out-of-sample fit (risk) was discussed in Section 8.2.3. In-sample fit of a regression is often measured with R2 (see (11.13)). Let’s make some further comments on R2 and then discuss how R2 relates to in-sample fit.
That R2⩽1 is immediate from ∥Py∥⩽∥y∥ (cf. theorem 2.2.2). Exercise 11.4.17 asks you to prove the second claim. More generally, a high R2 indicates y is relatively close to colspaceX. This fact suggests that we can increase R2 at least weakly by adding regressors. As we do so the column space of X expands, pushing out towards y. Here’s a formal statement:
High R2 is sometimes equated with successful regression. This is a misunderstanding of the aim of statistics. The correct definition of statistical learning is effective generalization from existing data. In the present context this means that the linear predictor produced by regression attains low risk.
So how does R2 relate to risk? What R2 actually measures is the degree to which empirical risk is minimized. To see this, note that
R2=1−TSSRSS=1−NTSSRemp(f^)
where Remp is as defined in (11.3) and f^ is our linear predictor f^(x)=x⊺β^. Thus high R2 means low empirical risk and good in-sample fit. But low empirical risk is no guarantee of low prediction risk, as was emphasized in Section 8.2.3.
Here’s a simulation that shows how we can produce high R2 without estimating anything meaningful. We take xn and yn as independent draws from a uniform distribution on [0,1]. By construction, there is no relationship between these two variables. For the regressors we take the powers 1,x,x2,…,xK, where K is a positive integer. The R code below runs these regressions for different values of K. At K=25 the value of R2 is around 0.95. This is despite the fact that no relationship exists between x and y.
set.seed(1234)
N <- 25
y <- runif(N)
x <- runif(N)
X <- rep(1, N)

Kmax <- 25
for (K in 1:Kmax) {
    X <- cbind(X, x^K)
    results <- lm(y ~ 0 + X)
    Py2 <- sum(results$fitted.values^2)
    y2 <- sum(y^2)
    cat("K =", K, "R^2 =", Py2 / y2, "\n")
}
To finish this section, let’s draw a connection between fact 11.1.2, which says that the value of R2 is at least weakly increasing in the number of right-hand side variables, and fact 8.2.1. Suppose that x lists a large number of possible regressors. Let the hypothesis space be
Here 1⩽j⩽K. Empirical risk minimization over Hj is equivalent to linear regression over the first j regressors. Empirical risk falls as j increases by fact 8.2.1. Hence R2 increases. This is the same conclusion as fact 11.1.2.
In discussing the decision to set H=Hℓ in Section 11.1.1, we mentioned that we can use many of the same ideas when extending H to a broader class of functions. The idea is to first transform the data using some arbitrary function ϕ:RK→RJ. The action of ϕ on x∈RK is
x↦ϕ(x)=ϕ1(x)ϕ2(x)⋮ϕJ(x)∈RJ
The individual functions ϕ1,…,ϕJ mapping RK into R are sometimes called basis functions. In machine learning texts, the range of ϕ is called feature space. Linear least squares is now applied in feature space. That is, we solve the empirical risk minimization problem when the hypothesis space is
Hϕ:={all functions ℓ∘ϕ, where ℓ is a linear function from RJ to R}
Assuming that Φ is full column rank, the solution is
γ^:=(Φ⊺Φ)−1Φ⊺y
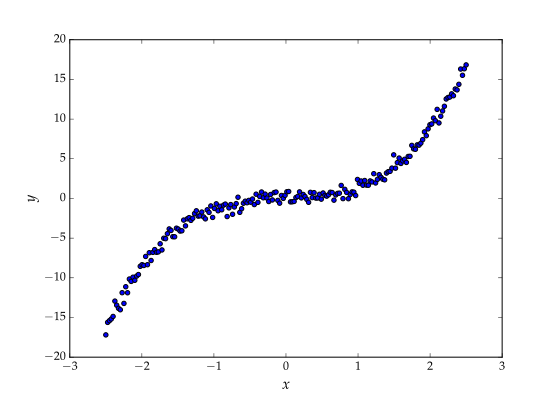
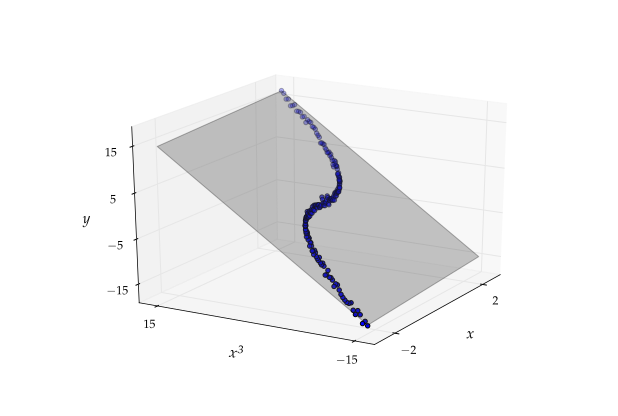
Figure 11.1 and Figure 11.2 help illustrate how transformations can reduce approximation error. In figure 11.1 it is clear that no linear function mapping x to y can produce small approximation error. Figure 11.2 shows the data after applying the transformation R∋x↦ϕ(x):=(x,x3)⊺∈R2. The plane drawn in figure 11.2 represents a linear function ℓ:R2→R. The composition ℓ∘ϕ has low approximation error. The two figures illustrate how nonlinear data can become linear when projected into higher dimensions.
Figure 11.1:Nonlinear relationship between x and y
Figure 11.2:Approximate linearity after projecting the data to R2
Below, when y is regressed on x, we can imagine that the data have already been transformed, and x is the result. Hence we use X to denote the design matrix instead of Φ without loss of generality.
The Frisch–Waugh–Lovell (FWL) theorem yields an expression for an arbitrary sub-vector of the least squares estimator β^ obtained by regressing y on X. In stating the theorem, we continue with the assumptions of Section 11.1. Let y and X be given and let β^ be as in (11.9). In addition, let K1 be an integer with 1⩽K1<K, and let
X1 be a matrix consisting of the first K1 columns of X,
X2 be a matrix consisting of the remaining K2:=K−K1 columns,
β^1 be the K1×1 vector consisting of the first K1 elements of β^.
β^2 be the K2×1 vector consisting of the remaining K2 elements of β^,
P1:=proj(colspaceX1), and
M1:=I−P1= the corresponding residual projection.
Close inspection of this formula confirms the following claim: There is another way to obtain β^2 besides just regressing y on X and then extracting the last K2 elements: we can also regress M1y on M1X2 to produce the same result.
To get some feeling for what this means, let’s look at a special case, where X2 is the single column colKX, containing the observations on the Kth regressor. To tie into this notation let’s write X1 as X−K to remind us that it stands for all columns of X expect the Kth one, and similarly for M1. In view of the preceding discussion, the least squares estimate β^K can be found by regressing
Loosely speaking, these two residual terms y~ and x~K can be thought of as the parts of y and colKX that are “not explained by” X−K. Thus, on an intuitive level, the process for obtaining the least squares estimate β^K is as follows:
Remove effects of all other regressors from y and colKX, producing y~ and x~K.
Regress y~ on x~K.
This is obviously different from the process for obtaining the coefficient of the vector colKX in a simple univariate regression, the latter being just
Regress y on colKX.
In words, the difference between the univariate least squares estimated coefficient of the Kth regressor and the multiple regression least squares coefficient is that the multiple regression coefficient β^K measures the isolated relationship between xK and y, without taking into account indirect channels involving other variables.
We can illustrate this idea further with a small simulation. Suppose that
y=x1+x2+uwhereu∼IIDN(0,1)
If we generate N independent observations from this model and regress y on the observations of (x1,x2), then, provided that N is sufficiently large, the coefficients for x1 and x2 will both be close to unity (see theorem 11.1.2). However, if we regress y on x1 alone, then the coefficient for x1 will depend on the relationship between x1 and x2. For example:
Here the coefficient for x1 is much larger than unity, because an increase in x1 tends to have a large positive effect on x2, which in turn increases y. The coefficient in the univariate regression reflects this total effect.
Here’s an easy application of the FWL theorem: deriving the familiar expression for the slope coefficient in simple linear regression (see Section 8.2.1.1) from the multivariate expression. Simple linear regression is a special case of multivariate regression when 1 is the first column of X and K=2. In this section, the second column of X will be denoted by x. As we saw in (8.14), the least squares estimates are
where Mc is the residual projection associated with the linear subspace S=span{1}, as defined in (3.10). For this residual projection Mc and any z, we have Mcz=z−zˉ1. Hence the right-hand sides of (11.28) and (11.29) coincide.
Let’s generalize the preceding discussion to the case where there are multiple nonconstant regressors. The only difference is that instead of one column x of observations on a single nonconstant regressor, we have a matrix X2 containing multiple columns, each a vector of observations on a nonconstant regressor. If the least squares estimate β^ is partitioned into (β^1,β^2), then we can write
Xβ^=1β1+X2β^2
Applying the FWL theorem (equation (11.25)) once more, we can write β^2 as
β^2=[(McX2)⊺McX2]−1(McX2)⊺Mcy
where Mc is the residual projection in (3.10). As we saw in the last section, Mcy is y centered around its mean. Similarly, McX2 is a matrix formed by taking each column of X2 and centering it around its mean. It follows that in a least squares regression with an intercept, the estimated coefficients of the nonconstant regressors are equal to the estimated coefficients of a zero-intercept regression performed after all variables have been centered around their mean.
Let’s use some related ideas to discuss an alternative to the coefficient of determination introduced in (11.13). There are several versions of R2 reported in common regression packages. One of these is so called centered R2. The version in (11.13) will henceforth be called the uncentered R2 for clarity.
One motivation for introducing an alternative to uncentered R2 is that it fails to be invariant to certain changes of units. While it is invariant to changes of units that involve rescaling of the regressand y (see ex. 11.4.2), it is not invariant to changes of units that involve addition or subtraction (actual inflation versus inflation in excess of a certain level, income versus income over a certain threshold, etc.) whenever X contains an intercept. Exercise 11.4.3 asks you to prove this.
This is one reason many econometricians use the centered R2 rather than R2, at least when the regression contains an intercept. For the purposes of this section, let’s assume that this is the case (or, more generally, that 1∈colspaceX). Centered R2 is defined as
Mc is as defined in (3.10). The equality of the two expressions for Rc2 is left as an exercise (ex. 11.4.6). Adding a constant to each element of y will have no effect on Rc2 because Mc maps constant vectors to 0 (see example 3.3.1).
It is a further exercise (ex. 11.4.5) to show that, in the case of the simple regression, the Rc2 is equal to the square of the sample correlation between the regressor and regressand, as defined in (8.5). Thus Rc2 is a measure of correlation.
For additional references on the material covered in this chapter see, for example, Friedman et al. (2009), Ruud (2000), Cameron & Trivedi (2005), or Davidson & MacKinnon (2004).
In essence, positive definiteness of Σx requires that no random variable in x can be written as a linear combination of other variables in x. See exercise 11.4.1.
Peysakhovich, A., & Naecker, J. (2015). Machine learning and behavioral economics: evaluating models of choice under risk and ambiguity [Techreport].
McKernan, S.-M., Ratcliffe, C., Steuerle, E., & Zhang, S. (2014). Disparities in wealth accumulation and loss from the great recession and beyond. American Economic Review, 104(5), 240–244.
Auffhammer, M., & Wolfram, C. D. (2014). Powering up China: income distributions and residential electricity consumption. American Economic Review, 104(5), 575–580.
Friedman, J., Hastie, T., & Tibshirani, R. (2009). The Elements of Statistical Learning (2nd ed.). New York: Springer.
Ruud, P. A. (2000). An Introduction to Classical Econometric Theory. Oxford: Oxford University Press.
Cameron, A. C., & Trivedi, P. K. (2005). Microeconometrics: Methods and Applications. Cambridge, UK: Cambridge University Press.
Davidson, R., & MacKinnon, J. G. (2004). Econometric Theory and Methods. Oxford: Oxford University Press.
Hong, Y., & White, H. (1995). Consistent specification testing via nonparametric series regression. Econometrica, 63(5), 1133–1159.
Sun, Y. (2011). Robust trend inference with series variance estimator and testing-optimal smoothing parameter. Journal of Econometrics, 164(2), 345–366.
Chen, X., & Christensen, T. M. (2015). Optimal uniform convergence rates and asymptotic normality for series estimators under weak dependence and weak conditions. Journal of Econometrics, 188, 447–465.