11. Matplotlib#

11.1. 概述#

在这些讲座中,我们已经使用 Matplotlib 生成了相当多的图形。

Matplotlib 是一个出色的图形库,专为科学计算设计,具有以下特点:

  • 高质量的二维和三维图形

  • 支持所有常见格式(PDF、PNG 等)的输出

  • LaTeX 集成

  • 对演示效果各方面的精细控制

  • 动画等功能

11.1.1. Matplotlib 的双重性格#

Matplotlib 的独特之处在于它提供了两种不同的绘图接口。

其一是简单的 MATLAB 风格 API(应用程序编程接口),这是为了帮助从 MATLAB 转来的用户能够快速上手而编写的。

另一种是更具”Python 风格”的面向对象 API。

出于下文所述的原因,我们建议您使用第二种 API。

但首先,让我们来讨论两者之间的区别。

11.2. API 接口#

11.2.1. MATLAB 风格 API#

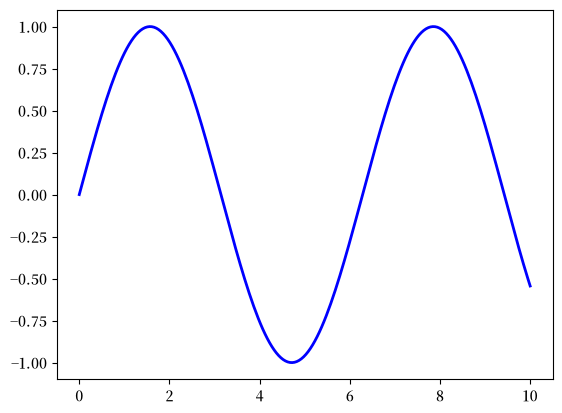
以下是您可能在入门教程中找到的简单示例

import matplotlib.pyplot as plt
import numpy as np
import matplotlib as mpl  # i18n
import matplotlib.font_manager  # i18n
FONTPATH = "_fonts/SourceHanSerifSC-SemiBold.otf"  # i18n
mpl.font_manager.fontManager.addfont(FONTPATH)  # i18n
mpl.rcParams['font.family'] = ['Source Han Serif SC']  # i18n

x = np.linspace(0, 10, 200)
y = np.sin(x)

plt.plot(x, y, 'b-', linewidth=2)
plt.show()
_images/3d6b4b7b5e3c133a19317c688764015e40ed08ba91edd334f16f6d6fdb94f625.png

这种方式简单方便,但也有一定局限性,且不够 Python 化。

例如,在函数调用中,许多对象被创建并传递,而程序员对此并不知情。

Python 程序员倾向于更明确的编程风格(在代码块中运行 import this 并查看第二行)。

这引导我们使用另一种替代方案——面向对象的 Matplotlib API。

11.2.2. 面向对象 API#

以下是使用面向对象 API 对应前述图形的代码

fig, ax = plt.subplots()
ax.plot(x, y, 'b-', linewidth=2)
plt.show()
_images/3d6b4b7b5e3c133a19317c688764015e40ed08ba91edd334f16f6d6fdb94f625.png

这里,调用 fig, ax = plt.subplots() 返回一个元组,其中

  • fig 是一个 Figure 实例——就像一块空白画布。

  • ax 是一个 AxesSubplot 实例——可以将其看作绘图的框架。

plot() 函数实际上是 ax 的一个方法。

虽然需要多写一些代码,但对象的更明确使用让我们拥有更好的控制能力。

随着我们的深入,这一点将变得更加清晰。

11.2.3. 调整#

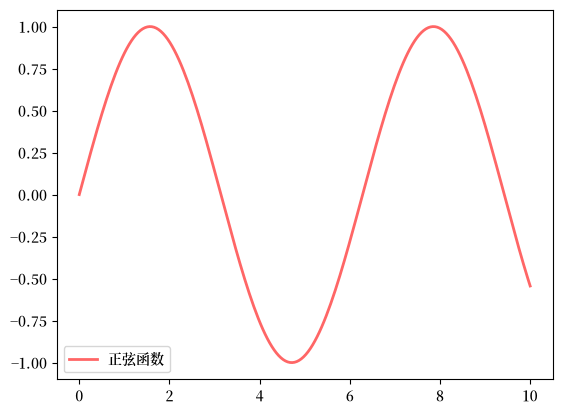
这里我们将线条改为红色并添加了图例

fig, ax = plt.subplots()
ax.plot(x, y, 'r-', linewidth=2, label='正弦函数', alpha=0.6)
ax.legend()
plt.show()
_images/75b286b32a376a6356df633382aa72fa341c140965cca35602c2642c3c31e99b.png

我们还使用了 alpha 使线条略微透明——这使其看起来更平滑。

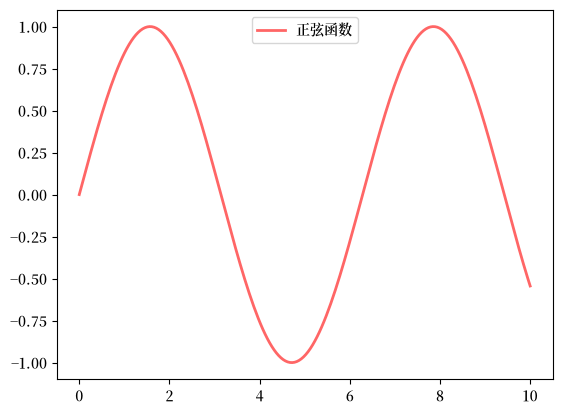
图例的位置可以通过将 ax.legend() 替换为 ax.legend(loc='upper center') 来改变。

fig, ax = plt.subplots()
ax.plot(x, y, 'r-', linewidth=2, label='正弦函数', alpha=0.6)
ax.legend(loc='upper center')
plt.show()
_images/894c1e414a94b1180b4efc157c7a52d1aed5aaa33ad9dfa40ea85290b887bf90.png

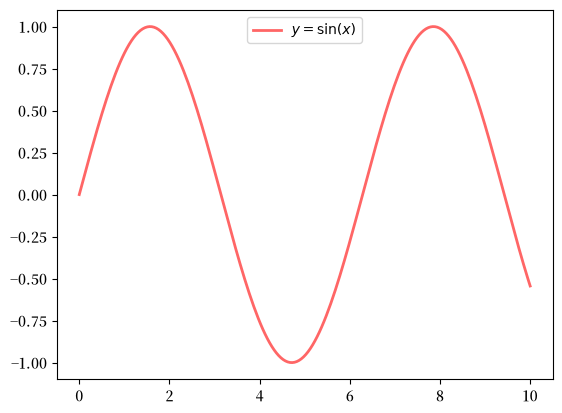
如果一切配置正确,添加 LaTeX 是轻而易举的

fig, ax = plt.subplots()
ax.plot(x, y, 'r-', linewidth=2, label=r'$y=\sin(x)$', alpha=0.6)
ax.legend(loc='upper center')
plt.show()
_images/c129a9db6ae3fa911d6746d5621ef507c91bc13365213ab5a442fd7a10590d4e.png

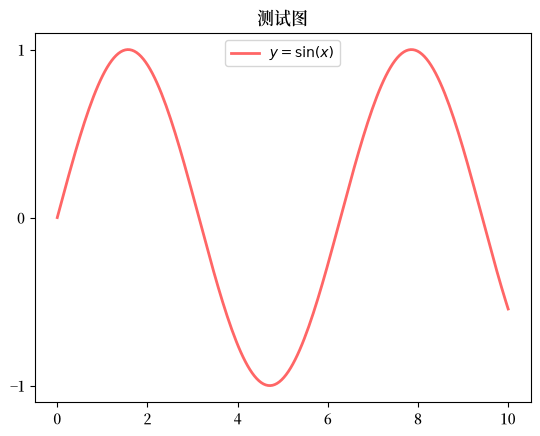
控制刻度、添加标题等操作也同样简单直接

fig, ax = plt.subplots()
ax.plot(x, y, 'r-', linewidth=2, label=r'$y=\sin(x)$', alpha=0.6)
ax.legend(loc='upper center')
ax.set_yticks([-1, 0, 1])
ax.set_title('测试图')
plt.show()
_images/66b219eb393576f927a2d7d18d586ccebdb2002a17a7131f4f9675773286b829.png

11.3. 更多特性#

Matplotlib 拥有大量的函数和特性,您可以随着需要逐渐发现它们。

我们仅介绍其中几个。

11.3.1. 在同一坐标轴上绘制多个图形#

在同一坐标轴上生成多个图形是很直接的。

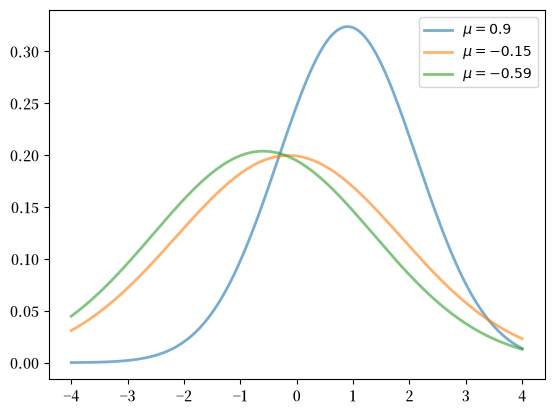
以下示例随机生成三个正态密度曲线,并添加各自均值的标签

from scipy.stats import norm
from random import uniform

fig, ax = plt.subplots()
x = np.linspace(-4, 4, 150)
for i in range(3):
    m, s = uniform(-1, 1), uniform(1, 2)
    y = norm.pdf(x, loc=m, scale=s)
    current_label = rf'$\mu = {m:.2}$'
    ax.plot(x, y, linewidth=2, alpha=0.6, label=current_label)
ax.legend()
plt.show()
_images/61b69b1507ff1951b9beaa73ed910f1cae3813ec045c2c475989b1e792fd21fd.png

11.3.2. 多个子图#

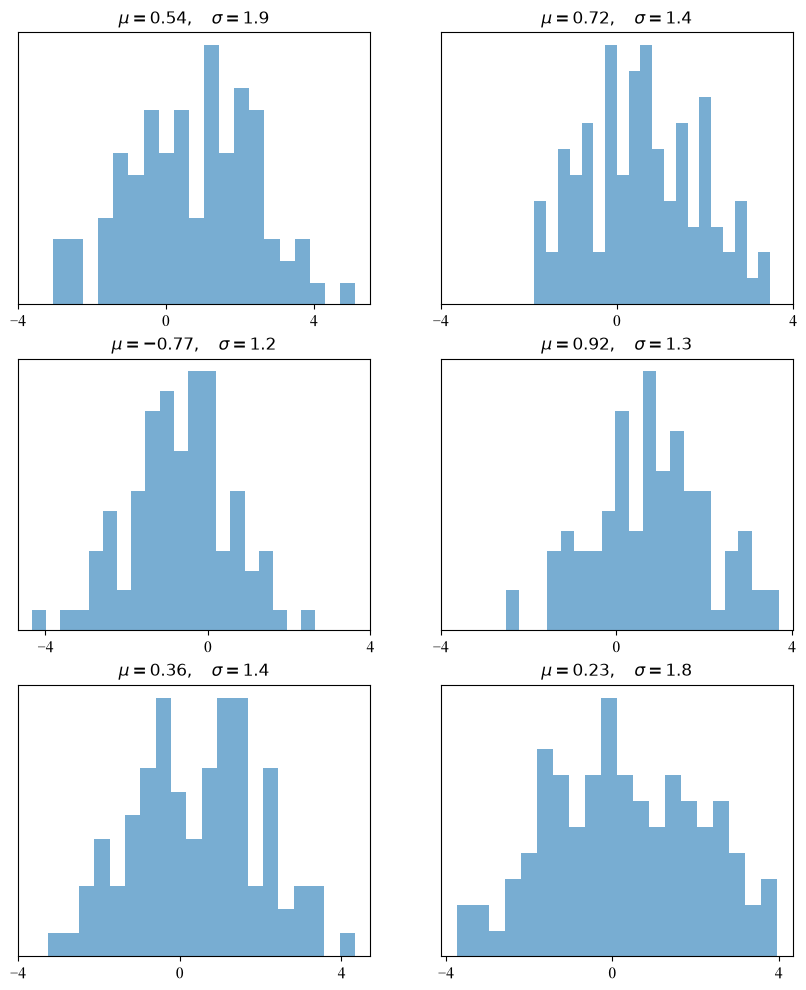
有时我们希望在一个图形中包含多个子图。

以下示例生成 6 个直方图

num_rows, num_cols = 3, 2
fig, axes = plt.subplots(num_rows, num_cols, figsize=(10, 12))
for i in range(num_rows):
    for j in range(num_cols):
        m, s = uniform(-1, 1), uniform(1, 2)
        x = norm.rvs(loc=m, scale=s, size=100)
        axes[i, j].hist(x, alpha=0.6, bins=20)
        t = rf'$\mu = {m:.2}, \quad \sigma = {s:.2}$'
        axes[i, j].set(title=t, xticks=[-4, 0, 4], yticks=[])
plt.show()
_images/c3f61fdca3de6ced89fcbb0de5440cea03fc206ed155b30a080a22bd8cb218cc.png

11.3.3. 三维图形#

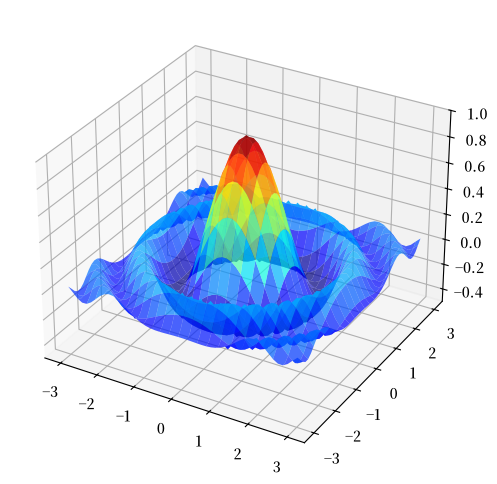
Matplotlib 在三维图形方面表现出色——以下是一个示例

from mpl_toolkits.mplot3d.axes3d import Axes3D
from matplotlib import cm


def f(x, y):
    return np.cos(x**2 + y**2) / (1 + x**2 + y**2)

xgrid = np.linspace(-3, 3, 50)
ygrid = xgrid
x, y = np.meshgrid(xgrid, ygrid)

fig = plt.figure(figsize=(10, 6))
ax = fig.add_subplot(111, projection='3d')
ax.plot_surface(x,
                y,
                f(x, y),
                rstride=2, cstride=2,
                cmap=cm.jet,
                alpha=0.7,
                linewidth=0.25)
ax.set_zlim(-0.5, 1.0)
plt.show()
_images/40d2a0dc9e7e15e7d22decee7584a53e777290a0101a8e631232db72eaf58ddf.png

11.3.4. 自定义函数#

也许您会发现一组您经常使用的自定义设置。

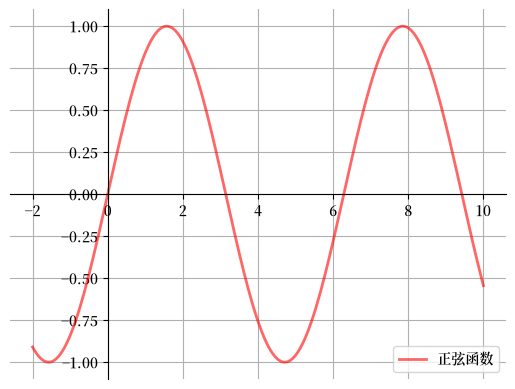
假设我们通常希望坐标轴过原点,并显示网格线。

以下是 Matthew Doty 提供的一个很好的示例,展示了如何使用面向对象 API 构建一个实现这些更改的自定义 subplots 函数。

仔细阅读代码,看看您是否能理解其中的逻辑

def subplots():
    "自定义坐标轴过原点的子图"
    fig, ax = plt.subplots()

    # 将坐标轴设置为过原点
    for spine in ['left', 'bottom']:
        ax.spines[spine].set_position('zero')
    for spine in ['right', 'top']:
        ax.spines[spine].set_color('none')

    ax.grid()
    return fig, ax


fig, ax = subplots()  # 调用本地版本,而非 plt.subplots()
x = np.linspace(-2, 10, 200)
y = np.sin(x)
ax.plot(x, y, 'r-', linewidth=2, label='正弦函数', alpha=0.6)
ax.legend(loc='lower right')
plt.show()
_images/ae04ea026357ee9dbf9939afca10d7abe3b7b6a71f402612a95a52e225e74bcb.png

自定义的 subplots 函数

  1. 在内部调用标准的 plt.subplots 函数以生成 fig, ax 对,

  2. ax 进行所需的自定义,

  3. fig, ax 对传回调用代码。

11.3.5. 样式表#

Matplotlib 的另一个有用特性是样式表

我们可以使用样式表来创建具有统一风格的图形。

我们可以通过打印属性 plt.style.available 来查找可用样式列表

print(plt.style.available)
['Solarize_Light2', '_classic_test_patch', '_mpl-gallery', '_mpl-gallery-nogrid', 'bmh', 'classic', 'dark_background', 'fast', 'fivethirtyeight', 'ggplot', 'grayscale', 'petroff10', 'seaborn-v0_8', 'seaborn-v0_8-bright', 'seaborn-v0_8-colorblind', 'seaborn-v0_8-dark', 'seaborn-v0_8-dark-palette', 'seaborn-v0_8-darkgrid', 'seaborn-v0_8-deep', 'seaborn-v0_8-muted', 'seaborn-v0_8-notebook', 'seaborn-v0_8-paper', 'seaborn-v0_8-pastel', 'seaborn-v0_8-poster', 'seaborn-v0_8-talk', 'seaborn-v0_8-ticks', 'seaborn-v0_8-white', 'seaborn-v0_8-whitegrid', 'tableau-colorblind10']

现在我们可以使用 plt.style.use() 方法来设置样式表。

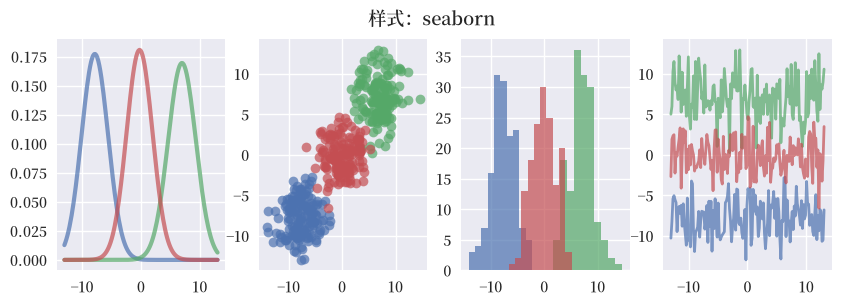
让我们编写一个函数,该函数接受样式表的名称并使用该样式绘制不同的图形

def draw_graphs(style='default'):

    # 设置样式表
    plt.style.use(style)

    fig, axes = plt.subplots(nrows=1, ncols=4, figsize=(10, 3))
    x = np.linspace(-13, 13, 150)

    # 设置随机种子以复现随机抽取结果
    np.random.seed(9)

    for i in range(3):

        # 从均匀分布中抽取均值和标准差
        m, s = np.random.uniform(-8, 8), np.random.uniform(2, 2.5)

        # 生成正态密度图
        y = norm.pdf(x, loc=m, scale=s)
        axes[0].plot(x, y, linewidth=3, alpha=0.7)

        # 从正态分布中创建具有随机 X 和 Y 值的散点图
        rnormX = norm.rvs(loc=m, scale=s, size=150)
        rnormY = norm.rvs(loc=m, scale=s, size=150)
        axes[1].plot(rnormX, rnormY, ls='none', marker='o', alpha=0.7)

        # 使用随机 X 值创建直方图
        axes[2].hist(rnormX, alpha=0.7)

        # 以及使用随机 Y 值的折线图
        axes[3].plot(x, rnormY, linewidth=2, alpha=0.7)

    style_name = style.split('-')[0]
    plt.suptitle(f'样式:{style_name}', fontsize=13)
    plt.show()

让我们来看看一些样式的效果。

首先,我们使用样式表 seaborn 绘制图形

draw_graphs(style='seaborn-v0_8')
/home/runner/miniconda3/envs/quantecon/lib/python3.13/site-packages/IPython/core/pylabtools.py:170: UserWarning: Glyph 26679 (\N{CJK UNIFIED IDEOGRAPH-6837}) missing from font(s) Liberation Sans.
  fig.canvas.print_figure(bytes_io, **kw)
/home/runner/miniconda3/envs/quantecon/lib/python3.13/site-packages/IPython/core/pylabtools.py:170: UserWarning: Glyph 24335 (\N{CJK UNIFIED IDEOGRAPH-5F0F}) missing from font(s) Liberation Sans.
  fig.canvas.print_figure(bytes_io, **kw)
/home/runner/miniconda3/envs/quantecon/lib/python3.13/site-packages/IPython/core/pylabtools.py:170: UserWarning: Glyph 65306 (\N{FULLWIDTH COLON}) missing from font(s) Liberation Sans.
  fig.canvas.print_figure(bytes_io, **kw)
_images/c183f0cdef80d4342bd2fcf206ec5640034e1a82ed99a74a43bebf4502d0074f.png

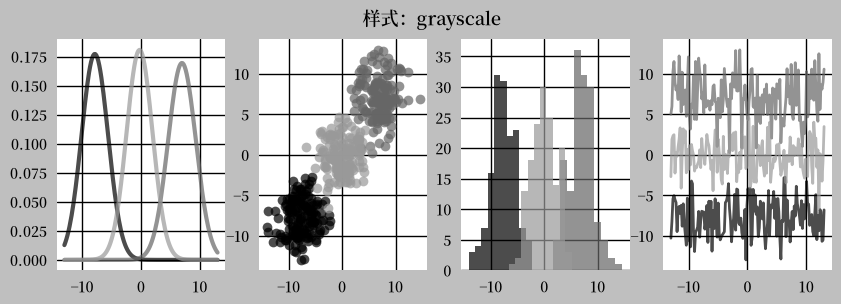
我们可以使用 grayscale 来去除图形中的颜色

draw_graphs(style='grayscale')
/home/runner/miniconda3/envs/quantecon/lib/python3.13/site-packages/IPython/core/pylabtools.py:170: UserWarning: Glyph 26679 (\N{CJK UNIFIED IDEOGRAPH-6837}) missing from font(s) Liberation Sans.
  fig.canvas.print_figure(bytes_io, **kw)
/home/runner/miniconda3/envs/quantecon/lib/python3.13/site-packages/IPython/core/pylabtools.py:170: UserWarning: Glyph 24335 (\N{CJK UNIFIED IDEOGRAPH-5F0F}) missing from font(s) Liberation Sans.
  fig.canvas.print_figure(bytes_io, **kw)
/home/runner/miniconda3/envs/quantecon/lib/python3.13/site-packages/IPython/core/pylabtools.py:170: UserWarning: Glyph 65306 (\N{FULLWIDTH COLON}) missing from font(s) Liberation Sans.
  fig.canvas.print_figure(bytes_io, **kw)
_images/6ed6715fd0492b144dafd354566ba8cb866683dbad7feac582d8895b6de34902.png

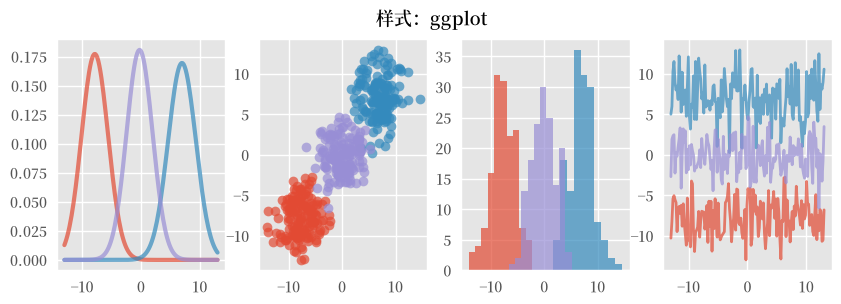
以下是 ggplot 的效果

draw_graphs(style='ggplot')
/home/runner/miniconda3/envs/quantecon/lib/python3.13/site-packages/IPython/core/pylabtools.py:170: UserWarning: Glyph 26679 (\N{CJK UNIFIED IDEOGRAPH-6837}) missing from font(s) Liberation Sans.
  fig.canvas.print_figure(bytes_io, **kw)
/home/runner/miniconda3/envs/quantecon/lib/python3.13/site-packages/IPython/core/pylabtools.py:170: UserWarning: Glyph 24335 (\N{CJK UNIFIED IDEOGRAPH-5F0F}) missing from font(s) Liberation Sans.
  fig.canvas.print_figure(bytes_io, **kw)
/home/runner/miniconda3/envs/quantecon/lib/python3.13/site-packages/IPython/core/pylabtools.py:170: UserWarning: Glyph 65306 (\N{FULLWIDTH COLON}) missing from font(s) Liberation Sans.
  fig.canvas.print_figure(bytes_io, **kw)
_images/1679f7e69c9bff35ee50a906f8cfbb47811435ade24b35827262dc32d643f710.png

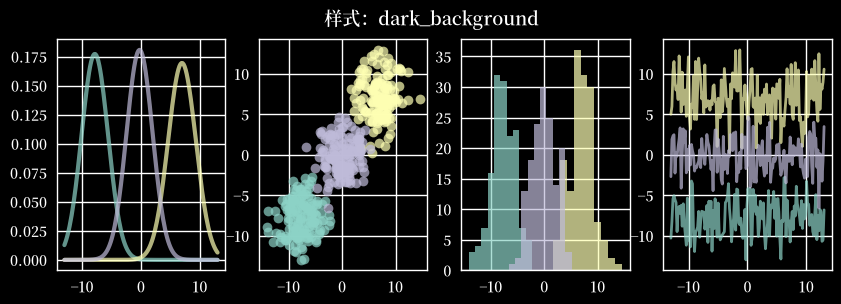
我们还可以使用 dark_background 样式

draw_graphs(style='dark_background')
/home/runner/miniconda3/envs/quantecon/lib/python3.13/site-packages/IPython/core/pylabtools.py:170: UserWarning: Glyph 26679 (\N{CJK UNIFIED IDEOGRAPH-6837}) missing from font(s) Liberation Sans.
  fig.canvas.print_figure(bytes_io, **kw)
/home/runner/miniconda3/envs/quantecon/lib/python3.13/site-packages/IPython/core/pylabtools.py:170: UserWarning: Glyph 24335 (\N{CJK UNIFIED IDEOGRAPH-5F0F}) missing from font(s) Liberation Sans.
  fig.canvas.print_figure(bytes_io, **kw)
/home/runner/miniconda3/envs/quantecon/lib/python3.13/site-packages/IPython/core/pylabtools.py:170: UserWarning: Glyph 65306 (\N{FULLWIDTH COLON}) missing from font(s) Liberation Sans.
  fig.canvas.print_figure(bytes_io, **kw)
_images/02fbe250b9babe5553029678a185e339f2c8679ac48ca0a60b783bc780d28e31.png

您可以使用该函数尝试列表中的其他样式。

如果您感兴趣,甚至可以创建自己的样式表。

您的样式表参数存储在类似字典的变量 plt.rcParams

print(plt.rcParams.keys())

Hide code cell output

KeysView(RcParams({'_internal.classic_mode': False,
          'agg.path.chunksize': 0,
          'animation.bitrate': -1,
          'animation.codec': 'h264',
          'animation.convert_args': ['-layers', 'OptimizePlus'],
          'animation.convert_path': 'convert',
          'animation.embed_limit': 20.0,
          'animation.ffmpeg_args': [],
          'animation.ffmpeg_path': 'ffmpeg',
          'animation.frame_format': 'png',
          'animation.html': 'none',
          'animation.writer': 'ffmpeg',
          'axes.autolimit_mode': 'data',
          'axes.axisbelow': True,
          'axes.edgecolor': 'white',
          'axes.facecolor': 'black',
          'axes.formatter.limits': [-5, 6],
          'axes.formatter.min_exponent': 0,
          'axes.formatter.offset_threshold': 4,
          'axes.formatter.use_locale': False,
          'axes.formatter.use_mathtext': False,
          'axes.formatter.useoffset': True,
          'axes.grid': True,
          'axes.grid.axis': 'both',
          'axes.grid.which': 'major',
          'axes.labelcolor': 'white',
          'axes.labelpad': 4.0,
          'axes.labelsize': 'large',
          'axes.labelweight': 'normal',
          'axes.linewidth': 1.0,
          'axes.prop_cycle': cycler('color', ['#8dd3c7', '#feffb3', '#bfbbd9', '#fa8174', '#81b1d2', '#fdb462', '#b3de69', '#bc82bd', '#ccebc4', '#ffed6f']),
          'axes.spines.bottom': True,
          'axes.spines.left': True,
          'axes.spines.right': True,
          'axes.spines.top': True,
          'axes.titlecolor': 'auto',
          'axes.titlelocation': 'center',
          'axes.titlepad': 6.0,
          'axes.titlesize': 'x-large',
          'axes.titleweight': 'normal',
          'axes.titley': None,
          'axes.unicode_minus': True,
          'axes.xmargin': 0.05,
          'axes.ymargin': 0.05,
          'axes.zmargin': 0.05,
          'axes3d.automargin': False,
          'axes3d.grid': True,
          'axes3d.mouserotationstyle': 'arcball',
          'axes3d.trackballborder': 0.2,
          'axes3d.trackballsize': 0.667,
          'axes3d.xaxis.panecolor': (0.95, 0.95, 0.95, 0.5),
          'axes3d.yaxis.panecolor': (0.9, 0.9, 0.9, 0.5),
          'axes3d.zaxis.panecolor': (0.925, 0.925, 0.925, 0.5),
          'backend': 'module://matplotlib_inline.backend_inline',
          'backend_fallback': True,
          'boxplot.bootstrap': None,
          'boxplot.boxprops.color': 'white',
          'boxplot.boxprops.linestyle': '-',
          'boxplot.boxprops.linewidth': 1.0,
          'boxplot.capprops.color': 'white',
          'boxplot.capprops.linestyle': '-',
          'boxplot.capprops.linewidth': 1.0,
          'boxplot.flierprops.color': 'white',
          'boxplot.flierprops.linestyle': 'none',
          'boxplot.flierprops.linewidth': 1.0,
          'boxplot.flierprops.marker': 'o',
          'boxplot.flierprops.markeredgecolor': 'white',
          'boxplot.flierprops.markeredgewidth': 1.0,
          'boxplot.flierprops.markerfacecolor': 'none',
          'boxplot.flierprops.markersize': 6.0,
          'boxplot.meanline': False,
          'boxplot.meanprops.color': 'C2',
          'boxplot.meanprops.linestyle': '--',
          'boxplot.meanprops.linewidth': 1.0,
          'boxplot.meanprops.marker': '^',
          'boxplot.meanprops.markeredgecolor': 'C2',
          'boxplot.meanprops.markerfacecolor': 'C2',
          'boxplot.meanprops.markersize': 6.0,
          'boxplot.medianprops.color': 'C1',
          'boxplot.medianprops.linestyle': '-',
          'boxplot.medianprops.linewidth': 1.0,
          'boxplot.notch': False,
          'boxplot.patchartist': False,
          'boxplot.showbox': True,
          'boxplot.showcaps': True,
          'boxplot.showfliers': True,
          'boxplot.showmeans': False,
          'boxplot.vertical': True,
          'boxplot.whiskerprops.color': 'white',
          'boxplot.whiskerprops.linestyle': '-',
          'boxplot.whiskerprops.linewidth': 1.0,
          'boxplot.whiskers': 1.5,
          'contour.algorithm': 'mpl2014',
          'contour.corner_mask': True,
          'contour.linewidth': None,
          'contour.negative_linestyle': 'dashed',
          'date.autoformatter.day': '%Y-%m-%d',
          'date.autoformatter.hour': '%m-%d %H',
          'date.autoformatter.microsecond': '%M:%S.%f',
          'date.autoformatter.minute': '%d %H:%M',
          'date.autoformatter.month': '%Y-%m',
          'date.autoformatter.second': '%H:%M:%S',
          'date.autoformatter.year': '%Y',
          'date.converter': 'auto',
          'date.epoch': '1970-01-01T00:00:00',
          'date.interval_multiples': True,
          'docstring.hardcopy': False,
          'errorbar.capsize': 0.0,
          'figure.autolayout': False,
          'figure.constrained_layout.h_pad': 0.04167,
          'figure.constrained_layout.hspace': 0.02,
          'figure.constrained_layout.use': False,
          'figure.constrained_layout.w_pad': 0.04167,
          'figure.constrained_layout.wspace': 0.02,
          'figure.dpi': 100.0,
          'figure.edgecolor': 'black',
          'figure.facecolor': 'black',
          'figure.figsize': [8.0, 5.5],
          'figure.frameon': True,
          'figure.hooks': [],
          'figure.labelsize': 'large',
          'figure.labelweight': 'normal',
          'figure.max_open_warning': 20,
          'figure.raise_window': True,
          'figure.subplot.bottom': 0.11,
          'figure.subplot.hspace': 0.2,
          'figure.subplot.left': 0.125,
          'figure.subplot.right': 0.9,
          'figure.subplot.top': 0.88,
          'figure.subplot.wspace': 0.2,
          'figure.titlesize': 'large',
          'figure.titleweight': 'normal',
          'font.cursive': ['Apple Chancery',
                           'Textile',
                           'Zapf Chancery',
                           'Sand',
                           'Script MT',
                           'Felipa',
                           'Comic Neue',
                           'Comic Sans MS',
                           'cursive'],
          'font.family': ['sans-serif'],
          'font.fantasy': ['Chicago',
                           'Charcoal',
                           'Impact',
                           'Western',
                           'xkcd script',
                           'fantasy'],
          'font.monospace': ['DejaVu Sans Mono',
                             'Bitstream Vera Sans Mono',
                             'Computer Modern Typewriter',
                             'Andale Mono',
                             'Nimbus Mono L',
                             'Courier New',
                             'Courier',
                             'Fixed',
                             'Terminal',
                             'monospace'],
          'font.sans-serif': ['Arial',
                              'Liberation Sans',
                              'DejaVu Sans',
                              'Bitstream Vera Sans',
                              'sans-serif'],
          'font.serif': ['DejaVu Serif',
                         'Bitstream Vera Serif',
                         'Computer Modern Roman',
                         'New Century Schoolbook',
                         'Century Schoolbook L',
                         'Utopia',
                         'ITC Bookman',
                         'Bookman',
                         'Nimbus Roman No9 L',
                         'Times New Roman',
                         'Times',
                         'Palatino',
                         'Charter',
                         'serif'],
          'font.size': 10.0,
          'font.stretch': 'normal',
          'font.style': 'normal',
          'font.variant': 'normal',
          'font.weight': 'normal',
          'grid.alpha': 1.0,
          'grid.color': 'white',
          'grid.linestyle': '-',
          'grid.linewidth': 1.0,
          'hatch.color': 'black',
          'hatch.linewidth': 1.0,
          'hist.bins': 10,
          'image.aspect': 'equal',
          'image.cmap': 'gray',
          'image.composite_image': True,
          'image.interpolation': 'auto',
          'image.interpolation_stage': 'auto',
          'image.lut': 256,
          'image.origin': 'upper',
          'image.resample': True,
          'interactive': True,
          'keymap.back': ['left', 'c', 'backspace', 'MouseButton.BACK'],
          'keymap.copy': ['ctrl+c', 'cmd+c'],
          'keymap.forward': ['right', 'v', 'MouseButton.FORWARD'],
          'keymap.fullscreen': ['f', 'ctrl+f'],
          'keymap.grid': ['g'],
          'keymap.grid_minor': ['G'],
          'keymap.help': ['f1'],
          'keymap.home': ['h', 'r', 'home'],
          'keymap.pan': ['p'],
          'keymap.quit': ['ctrl+w', 'cmd+w', 'q'],
          'keymap.quit_all': [],
          'keymap.save': ['s', 'ctrl+s'],
          'keymap.xscale': ['k', 'L'],
          'keymap.yscale': ['l'],
          'keymap.zoom': ['o'],
          'legend.borderaxespad': 0.5,
          'legend.borderpad': 0.4,
          'legend.columnspacing': 2.0,
          'legend.edgecolor': '0.8',
          'legend.facecolor': 'inherit',
          'legend.fancybox': True,
          'legend.fontsize': 10.0,
          'legend.framealpha': 0.8,
          'legend.frameon': False,
          'legend.handleheight': 0.7,
          'legend.handlelength': 2.0,
          'legend.handletextpad': 0.8,
          'legend.labelcolor': 'None',
          'legend.labelspacing': 0.5,
          'legend.loc': 'best',
          'legend.markerscale': 1.0,
          'legend.numpoints': 1,
          'legend.scatterpoints': 1,
          'legend.shadow': False,
          'legend.title_fontsize': None,
          'lines.antialiased': True,
          'lines.color': 'white',
          'lines.dash_capstyle': <CapStyle.butt: 'butt'>,
          'lines.dash_joinstyle': <JoinStyle.round: 'round'>,
          'lines.dashdot_pattern': [6.4, 1.6, 1.0, 1.6],
          'lines.dashed_pattern': [3.7, 1.6],
          'lines.dotted_pattern': [1.0, 1.65],
          'lines.linestyle': '-',
          'lines.linewidth': 1.75,
          'lines.marker': 'None',
          'lines.markeredgecolor': 'auto',
          'lines.markeredgewidth': 0.0,
          'lines.markerfacecolor': 'auto',
          'lines.markersize': 7.0,
          'lines.scale_dashes': True,
          'lines.solid_capstyle': <CapStyle.round: 'round'>,
          'lines.solid_joinstyle': <JoinStyle.round: 'round'>,
          'macosx.window_mode': 'system',
          'markers.fillstyle': 'full',
          'mathtext.bf': 'sans:bold',
          'mathtext.bfit': 'sans:italic:bold',
          'mathtext.cal': 'cursive',
          'mathtext.default': 'it',
          'mathtext.fallback': 'cm',
          'mathtext.fontset': 'dejavusans',
          'mathtext.it': 'sans:italic',
          'mathtext.rm': 'sans',
          'mathtext.sf': 'sans',
          'mathtext.tt': 'monospace',
          'patch.antialiased': True,
          'patch.edgecolor': 'white',
          'patch.facecolor': '#348ABD',
          'patch.force_edgecolor': False,
          'patch.linewidth': 0.5,
          'path.effects': [],
          'path.simplify': True,
          'path.simplify_threshold': 0.111111111111,
          'path.sketch': None,
          'path.snap': True,
          'pcolor.shading': 'auto',
          'pcolormesh.snap': True,
          'pdf.compression': 6,
          'pdf.fonttype': 3,
          'pdf.inheritcolor': False,
          'pdf.use14corefonts': False,
          'pgf.preamble': '',
          'pgf.rcfonts': True,
          'pgf.texsystem': 'xelatex',
          'polaraxes.grid': True,
          'ps.distiller.res': 6000,
          'ps.fonttype': 3,
          'ps.papersize': 'letter',
          'ps.useafm': False,
          'ps.usedistiller': None,
          'savefig.bbox': None,
          'savefig.directory': '~',
          'savefig.dpi': 'figure',
          'savefig.edgecolor': 'white',
          'savefig.facecolor': 'white',
          'savefig.format': 'png',
          'savefig.orientation': 'portrait',
          'savefig.pad_inches': 0.1,
          'savefig.transparent': False,
          'scatter.edgecolors': 'face',
          'scatter.marker': 'o',
          'svg.fonttype': 'path',
          'svg.hashsalt': None,
          'svg.id': None,
          'svg.image_inline': True,
          'text.antialiased': True,
          'text.color': 'white',
          'text.hinting': 'force_autohint',
          'text.hinting_factor': 8,
          'text.kerning_factor': 0,
          'text.latex.preamble': '',
          'text.parse_math': True,
          'text.usetex': False,
          'timezone': 'UTC',
          'tk.window_focus': False,
          'toolbar': 'toolbar2',
          'webagg.address': '127.0.0.1',
          'webagg.open_in_browser': True,
          'webagg.port': 8988,
          'webagg.port_retries': 50,
          'xaxis.labellocation': 'center',
          'xtick.alignment': 'center',
          'xtick.bottom': True,
          'xtick.color': 'white',
          'xtick.direction': 'out',
          'xtick.labelbottom': True,
          'xtick.labelcolor': 'inherit',
          'xtick.labelsize': 10.0,
          'xtick.labeltop': False,
          'xtick.major.bottom': True,
          'xtick.major.pad': 7.0,
          'xtick.major.size': 0.0,
          'xtick.major.top': True,
          'xtick.major.width': 1.0,
          'xtick.minor.bottom': True,
          'xtick.minor.ndivs': 'auto',
          'xtick.minor.pad': 3.4,
          'xtick.minor.size': 0.0,
          'xtick.minor.top': True,
          'xtick.minor.visible': False,
          'xtick.minor.width': 0.5,
          'xtick.top': False,
          'yaxis.labellocation': 'center',
          'ytick.alignment': 'center_baseline',
          'ytick.color': 'white',
          'ytick.direction': 'out',
          'ytick.labelcolor': 'inherit',
          'ytick.labelleft': True,
          'ytick.labelright': False,
          'ytick.labelsize': 10.0,
          'ytick.left': True,
          'ytick.major.left': True,
          'ytick.major.pad': 7.0,
          'ytick.major.right': True,
          'ytick.major.size': 0.0,
          'ytick.major.width': 1.0,
          'ytick.minor.left': True,
          'ytick.minor.ndivs': 'auto',
          'ytick.minor.pad': 3.4,
          'ytick.minor.right': True,
          'ytick.minor.size': 0.0,
          'ytick.minor.visible': False,
          'ytick.minor.width': 0.5,
          'ytick.right': False}))

您可以为样式表设置许多参数。

通过以下方式设置样式表的参数:

  1. 创建您自己的 matplotlibrc 文件,或

  2. 更新存储在类似字典变量 plt.rcParams 中的值

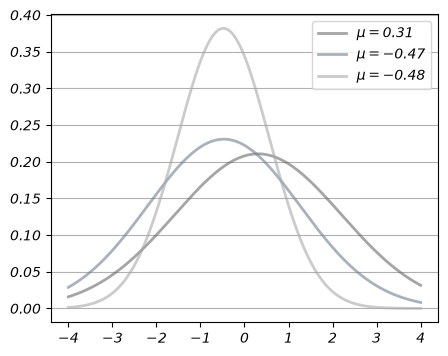
让我们使用第二种方法更改叠加密度线的样式

from cycler import cycler

# 设置为默认样式表
plt.style.use('default')

# 您可以使用键更新单个值:

# 将字体样式设置为斜体
plt.rcParams['font.style'] = 'italic'

# 更新线宽
plt.rcParams['lines.linewidth'] = 2


# 您也可以使用 update() 方法一次更新多个值:

parameters = {

    # 更改默认图形大小
    'figure.figsize': (5, 4),

    # 添加水平网格线
    'axes.grid': True,
    'axes.grid.axis': 'y',

    # 更新密度线的颜色
    'axes.prop_cycle': cycler('color', 
                            ['dimgray', 'slategrey', 'darkgray'])
}

plt.rcParams.update(parameters)

Note

这些设置是全局的。

.rcParams 中更改参数后生成的任何图形都将受到该设置的影响。

fig, ax = plt.subplots()
x = np.linspace(-4, 4, 150)
for i in range(3):
    m, s = uniform(-1, 1), uniform(1, 2)
    y = norm.pdf(x, loc=m, scale=s)
    current_label = rf'$\mu = {m:.2}$'
    ax.plot(x, y, linewidth=2, alpha=0.6, label=current_label)
ax.legend()
plt.show()
_images/4f50a0d9bed3b4babf63d65b2956e5e5e36898e2baa4d352fa61ed0ea2fedf67.png

再次应用 default 样式表将您的样式恢复为默认值

plt.style.use('default')

# 重置默认图形大小
plt.rcParams['figure.figsize'] = (10, 6)

11.4. 延伸阅读#

  • Matplotlib 图库 提供了许多示例。

  • Nicolas Rougier、Mike Muller 和 Gael Varoquaux 编写的一份精彩的 Matplotlib 教程

  • mpltools 允许在图形样式之间轻松切换。

  • Seaborn 简化了 Matplotlib 中常见统计图形的绘制。

11.5. 练习#

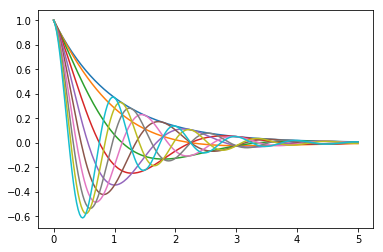
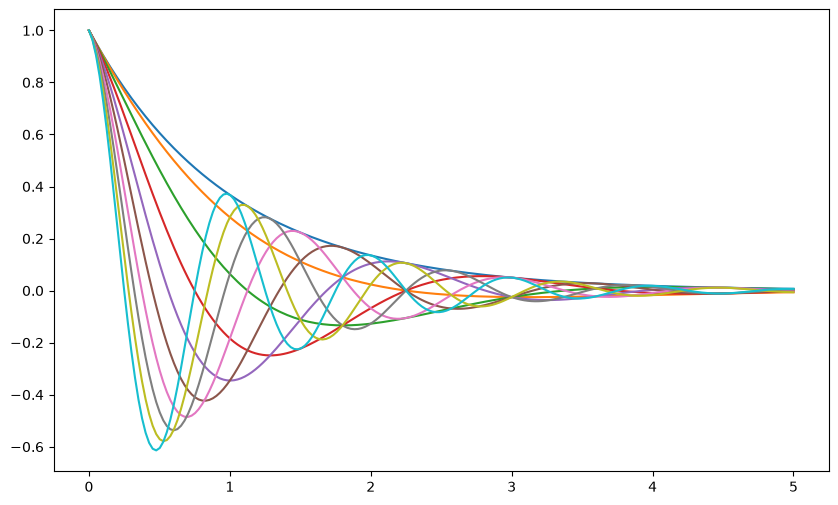
Exercise 11.1

在区间 \([0, 5]\) 上,对 np.linspace(0, 2, 10) 中的每个 \(\theta\),绘制函数

\[ f(x) = \cos(\pi \theta x) \exp(-x) \]

将所有曲线放在同一图形中。

输出结果应如下所示

_images/matplotlib_ex1.png